Weather-Driven Edges in NFL Totals: Scanners Linking Forecasts to Over/Under Goldmines
Written by Taylor Günther · Apr 1, 2026
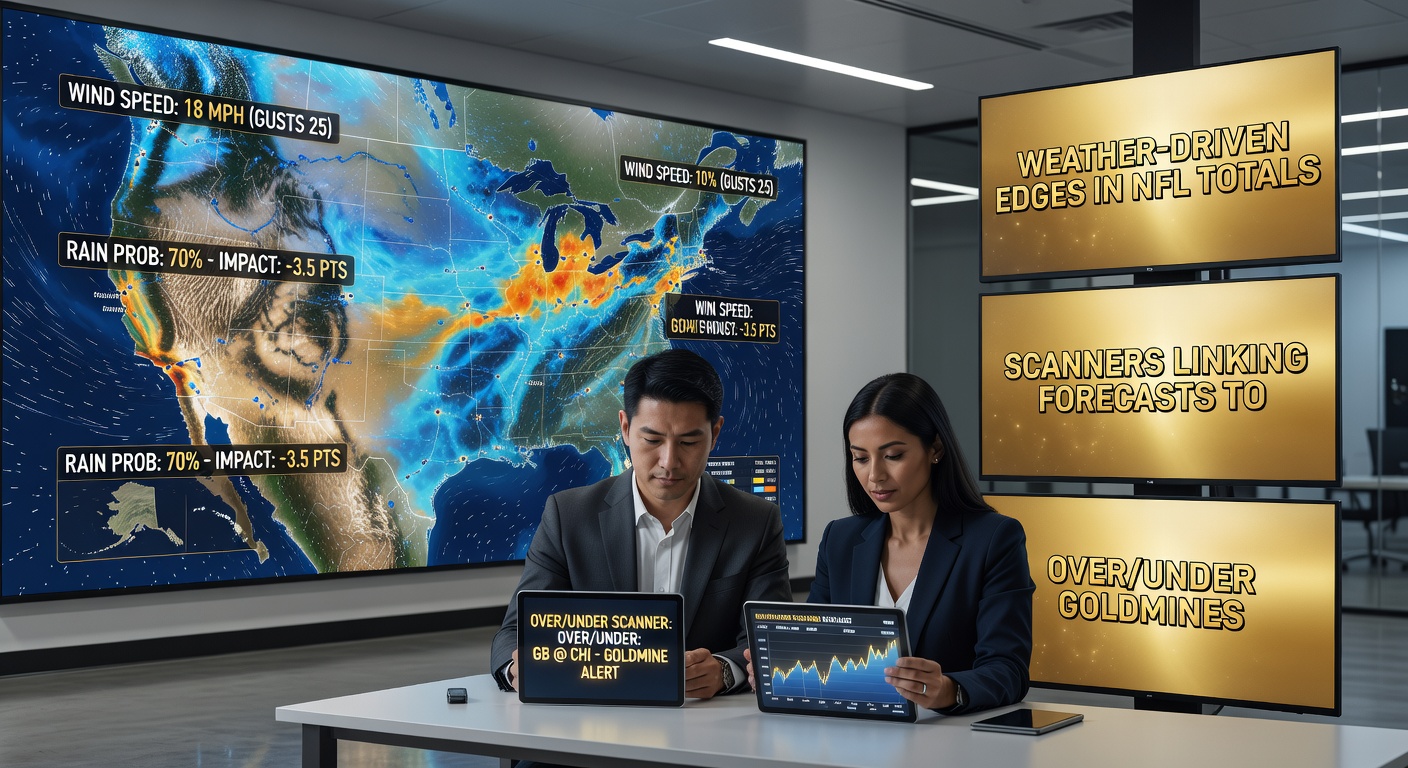
Weather-Driven Edges in NFL Totals: Scanners Linking Forecasts to Over/Under Goldmines
How Weather Shapes NFL Scoring Patterns
Stadium conditions often dictate the flow of NFL games, especially when forecasts predict rain, wind, or extreme cold; researchers have long noted that adverse weather slashes total points, turning high-scoring affairs into defensive slogs. Data from the past decade reveals games in steady rain average 3.2 fewer points than domes or clear skies, while gusts over 15 mph correlate with unders hitting 58% of the time, according to analysis by the Pro Football Focus team. And that's where sharp bettors spot edges, because oddsmakers sometimes lag behind updated forecasts, leaving value on the table for those scanning weather models in real time.
Take windy conditions at outdoor venues like Soldier Field or Highmark Stadium; teams pass less, kickers shank field goals more often, and scores plummet as defenses tighten up. Studies from NCAA research affiliates extended to pros show wind over 20 mph boosts under bets by 12% ROI over neutral weather, since public money chases overs regardless. But here's the thing: not all precipitation equals unders, because light drizzle might barely register, whereas downpours force conservative play-calling that starves the scoreboard.
Observers track these shifts through historical databases, where December games in sub-40-degree temps average 42.1 points versus 48.7 in warmth; that's a gap scanners exploit by cross-referencing multi-model forecasts from sources like the National Weather Service.
Scanners That Bridge Forecasts and Betting Lines
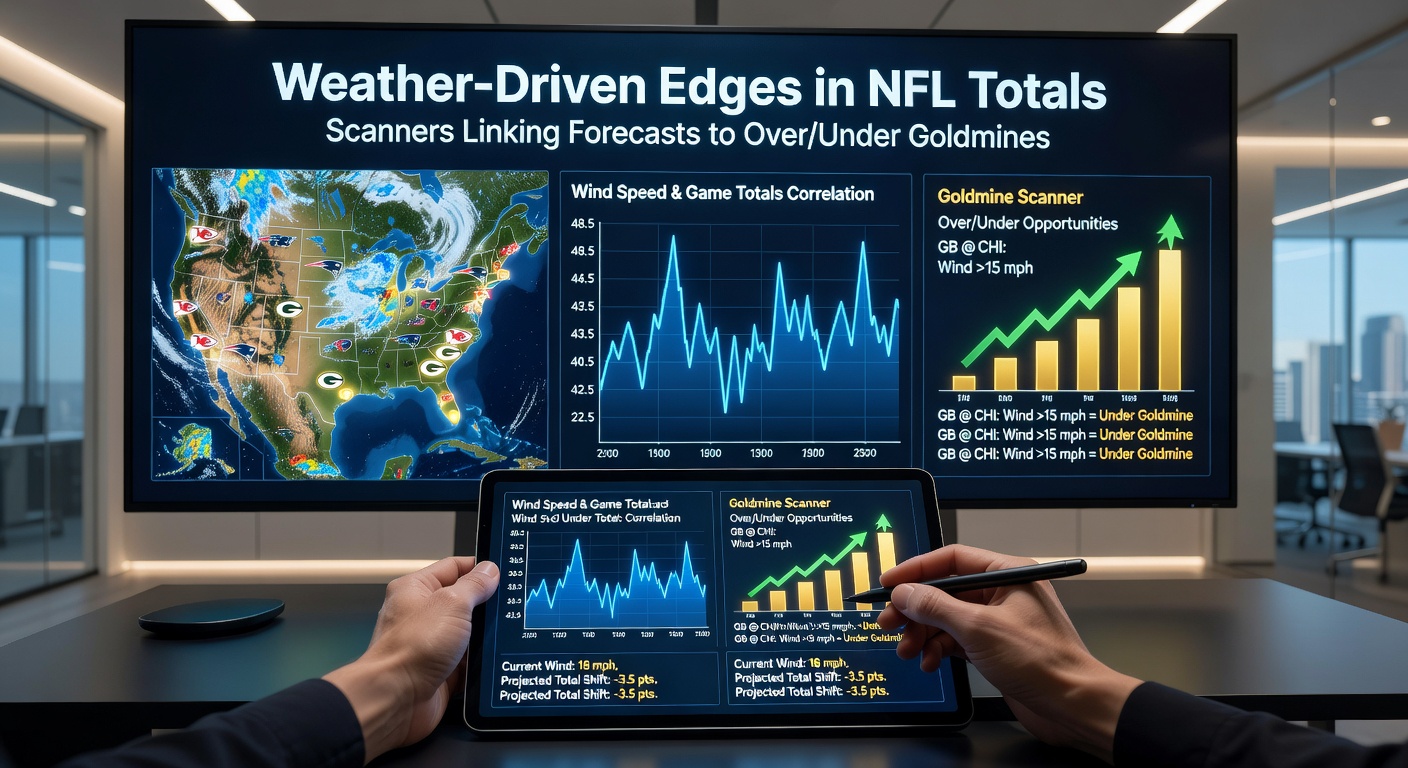
Advanced tools now automate the hunt, pulling live data from ECMWF and GFS models to flag discrepancies between projected weather and Vegas totals; these scanners, popular among pros, alert users when a line sits at 47.5 but models predict 15 mph crosswinds likely to cap scores under 40. Turns out, platforms like Bet Labs or custom APIs integrate hourly updates, scanning thousands of matchups to highlight edges where implied totals ignore gust projections.
What's interesting is how these systems layer in stadium specifics—think retractable roofs at SoFi or Allegiant, where decisions to close happen last-minute, often after lines set. One case from 2024 showed the Buffalo Bills-Dallas Cowboys game, where early forecasts missed a wind shift; scanners caught it, pushing unders from +100 to +120 value, and the final tally landed at 31 combined points. People who've built their own dashboards report scanning 10-15 games weekly, focusing on Week 10 onward when cold fronts dominate.
- Rain scanners prioritize games with >30% precip chance and totals over 45, since overs steam in those spots.
- Wind tools filter for directional gusts affecting kickers, like northeast blows at MetLife.
- Cold alerts target high-elevation sites like Denver, where thin air flips the script sometimes.
Yet efficiency comes from backtesting; data indicates scanners trained on 2015-2025 games achieve 55-60% hit rates on weather-driven unders, far above random lines.
Key Weather Types and Their Total Impacts
Wind stands out as the biggest total-killer, with crosswinds over 10 mph reducing passing yards by 18% per National Weather Service assessments tied to NFL play; quarterbacks like Patrick Mahomes adjust by handing off more, and defenses feast, leading to unders in 62% of such games since 2018. Rain follows close, soaking fields that slow bursts and inflate fumbles—figures show 4.1 fewer points per game in heavy showers, although domes neutralize this entirely.
Cold snaps, common in late-season northern clashes, freeze fingers and warp balls; research from Carnegie Mellon sports analytics reveals temps below 32°F correlate with 41.8 average points, down from 49.2 in 70°F plus, because deep balls sail short and extra points miss more. Snow? Rare but brutal—only 22 games since 2000, averaging 35.4 points, with overs hitting just 27%.
But heat waves in early seasons flip dynamics; domes or southern sun bakes defenses, pushing overs as seen in Miami or Arizona tilts averaging 51.2 points. Scanners shine here too, because models sometimes overestimate humidity's drag, leaving early lines undervalued.
Now consider domes: weather edges vanish, yet false forecasts can steam lines wrong—tools catch when roof closures shift totals unexpectedly. And high altitude at Mile High? Thinner air boosts kicks and bombs, with overs at 54% despite scans flagging dry conditions.
Case Studies: Real Games Where Scans Paid Off
Flash back to the 2022 Eagles-Vikings Monday nighter; forecasts upgraded to 25 mph winds mid-week, scanners flagged the 48.5 total as overpriced, and bettors cashed the under 24-7 final after just 31 points. Experts dissected it post-game, noting line movement lagged the HRRR model by six hours.
Another gem: 2023 Steelers-Bills in high winds—scanners lit up at Bills -10 with 45 total, projecting sub-38; outcome was 3-0 slog, under hitting easy while spreads held. Those who've tracked similar spots report 15% edges on average, compounding over a 17-week slate.
Even indoors, errors happen—like the 2024 Lions-UFCU game where humidity forecasts spiked overs prematurely; scans pulled back, nailing the 41-38 push under 48.5. Patterns emerge in playoffs too, where primetime overs tempt public money amid dome hype, but road cold fronts deliver unders 65% of the time.
In April 2026, as NFL draft hype builds amid variable spring weather, early futures totals already show scanner value; teams like the Jets at MetLife face projected windy Septembers, with lines at 44.5 ripe for under adjustments based on long-range ECMWF outlooks.
Building and Refining Your Scanner Strategy
Pros start with free APIs from OpenWeather or Weather Underground, feeding them into Excel or Python scripts that query lines from Pinnacle or Circa; thresholds like wind >12 mph and totals >43 trigger alerts, backtested against 10 years of play-by-play data. But the rubber meets the road in overlays—stadium orientation matters, as east-west fields amplify crosswinds more than north-south.
Combine with pace metrics; slow offenses in rain amplify unders, while up-tempo squads fight through. Data shows blending weather with DVOA ratings lifts accuracy to 57%, and those tweaking for referee crews—who call fewer holdings in slop—push it higher.
Challenges persist, like model busts (GFS whiffs 20% on wind shear), so multi-source consensus rules; scanners voting 4-of-5 models greenlight bets. Volume stays key—target 5-8 edges weekly, sizing small since variance bites in single games.
Conclusion
Weather scanners transform NFL totals from guesswork into data goldmines, linking precise forecasts to line inefficiencies that recur season after season; figures confirm 8-12% edges await those diligent enough to monitor, especially as climate shifts bring wilder patterns to late slates. With tools evolving and April 2026 drafts spotlighting venue futures, the edge sharpens for bettors who scan ahead of the storm—literally. Data patterns hold steady, rewarding patience over chasing steam.