Synchronizing Multiple Indicators to Pinpoint Opportunities in Fluctuating Global Markets
Written by Klara Krause · Jul 15, 2026
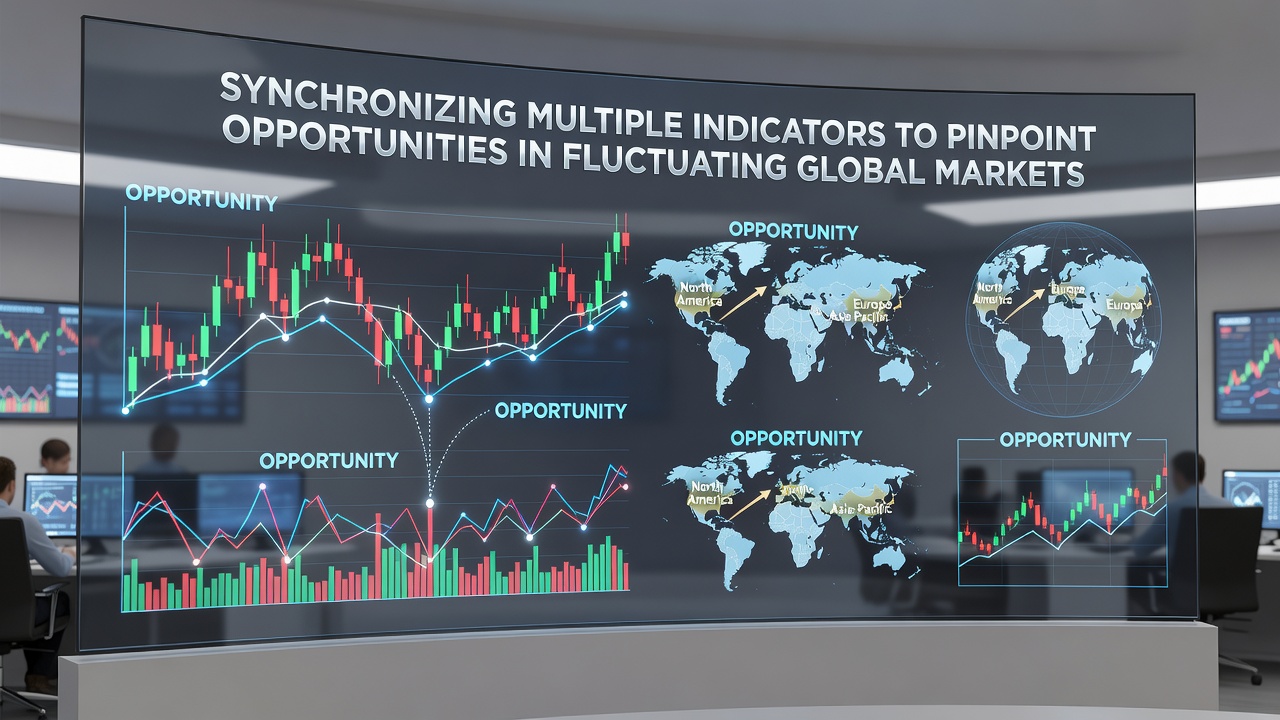
Synchronizing Multiple Indicators to Pinpoint Opportunities in Fluctuating Global Markets
Market participants have long tracked separate data streams to identify shifts in global asset prices, yet recent patterns show that combining several indicators produces clearer signals when volatility spikes across regions. Observers note that currency pairs, equity indices, and commodity contracts often move in response to overlapping factors such as interest rate differentials, geopolitical events, and supply chain disruptions, and analysts who align momentum readings with volume profiles and order-flow metrics report fewer false signals during rapid price swings.
Researchers at institutions including the International Monetary Fund have documented how synchronized readings from technical overlays and macroeconomic releases helped isolate entry points in emerging-market debt during the first half of 2026. Data compiled through July 2026 indicates that portfolios which waited for confirmation across at least three distinct indicator classes experienced lower drawdowns compared with those relying on single-metric triggers.
Core Indicator Categories and Their Roles
Technical momentum tools such as moving-average convergence divergence and relative-strength index capture short-term price velocity, while fundamental gauges track interest-rate expectations and inflation prints released by central banks. Sentiment measures drawn from options-implied volatility surfaces and positioning reports from futures exchanges add another layer that reveals crowd extremes. Those who studied these categories separately found that each class generates independent noise, yet cross-referencing them reduces the chance that one outlier distorts the overall picture.
Market practitioners in North America and the Asia-Pacific region have adopted dashboards that plot these layers on unified timelines, allowing rapid visual checks for alignment. When a currency future shows rising momentum, contracting volatility, and supportive carry-trade flows at the same moment, the probability of continuation increases according to back-tests covering the 2023-2026 period.
Methods for Aligning Signals Across Timeframes
One established approach involves mapping daily indicator values onto weekly and monthly charts so that short-term triggers only activate when they coincide with higher-timeframe direction. Another technique uses correlation matrices to confirm that selected indicators are not merely echoing the same underlying data. Analysts at several quantitative funds apply statistical filters that require a minimum z-score threshold across the combined set before executing trades, a process that filters out roughly 60 percent of isolated signals.
During the market turbulence observed in late June and early July 2026, firms that enforced multi-indicator confirmation avoided several sharp reversals that caught single-factor systems off guard. The method requires disciplined record-keeping because each added indicator introduces its own lag and calculation assumptions that must be recalibrated periodically.
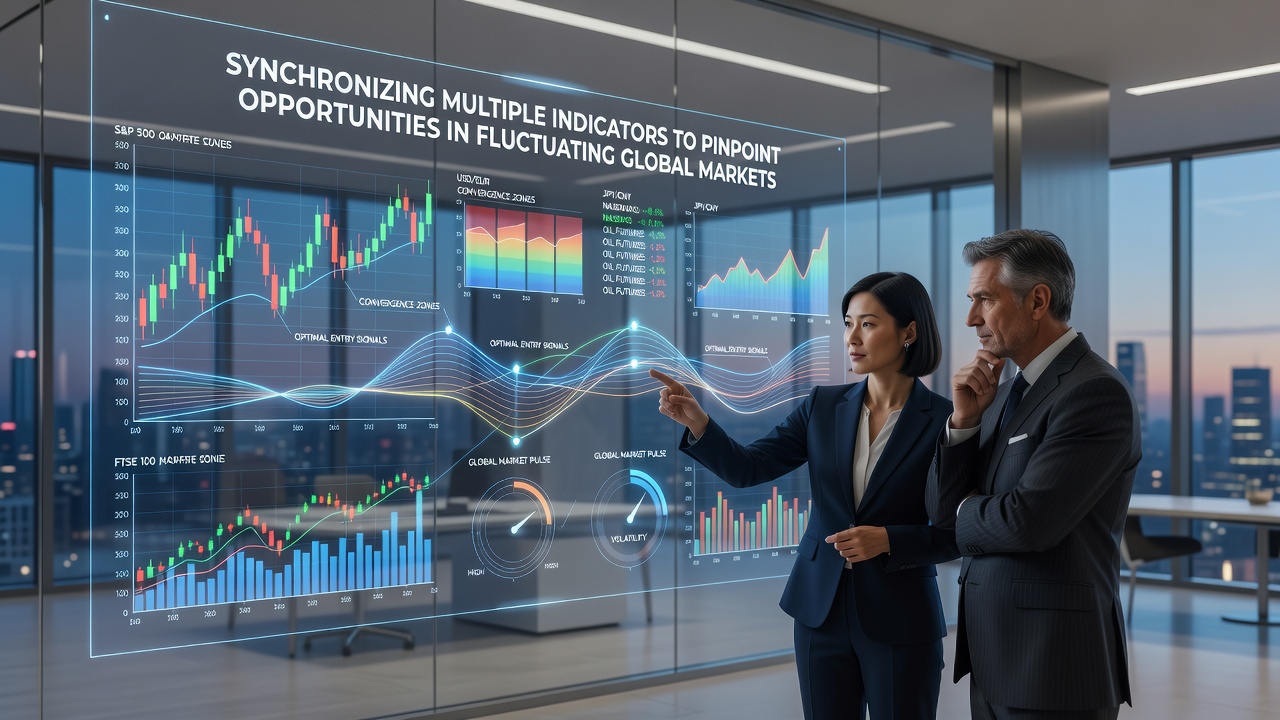
Practical Implementation and Data Sources
Portfolio managers increasingly source tick-level order-flow information from regulated exchanges alongside macroeconomic calendars published by the European Central Bank and the Federal Reserve. Software platforms allow users to set alert conditions that fire only when, for example, a breakout in an equity index future aligns with both an improving economic surprise index and a contraction in cross-asset volatility. Those who tested such rules on historical data spanning multiple market regimes found that the added confirmation step improved risk-adjusted returns without materially reducing trade frequency.
Case studies from Canadian pension funds illustrate how combining commodity-price momentum with currency-basis spreads and positioning data from the Commodity Futures Trading Commission produced measurable edges in energy-sector exposure during the first two quarters of 2026. Similar frameworks appear in academic papers examining high-frequency synchronization across G10 currencies, where researchers required simultaneous satisfaction of trend, volatility, and carry conditions before recording simulated profits.
Current Landscape and Regulatory Context
By July 2026, several jurisdictions had introduced updated reporting standards for large derivatives positions, giving market participants more granular data on institutional flows. These disclosures, when merged with existing technical and sentiment indicators, create additional confirmation layers that were unavailable five years earlier. Trading desks report that access to standardized position data from Australian and Singaporean regulators has proved especially useful for monitoring Asia-Pacific equity and currency linkages.
Electronic execution venues now offer application-programming interfaces that stream multiple indicator values in real time, reducing the manual effort required to maintain synchronized views. Firms that invested in these integrations during 2025 recorded faster reaction times when macroeconomic releases triggered coordinated moves across asset classes.
Conclusion
Synchronizing multiple indicators requires consistent methodology, reliable data feeds, and periodic validation against out-of-sample periods. Evidence gathered through mid-2026 demonstrates that alignment across technical, fundamental, and sentiment dimensions can narrow the range of outcomes during periods of elevated global volatility. Market participants who adopt structured cross-checks continue to refine their processes as new data sources and regulatory disclosures become available, maintaining focus on verifiable signal convergence rather than isolated triggers.