Rugby League's Seasonal Swings: Mapping Volatility for Predictable Market Returns
Written by Carlo Krüger · May 17, 2026
Rugby League's Seasonal Swings: Mapping Volatility for Predictable Market Returns
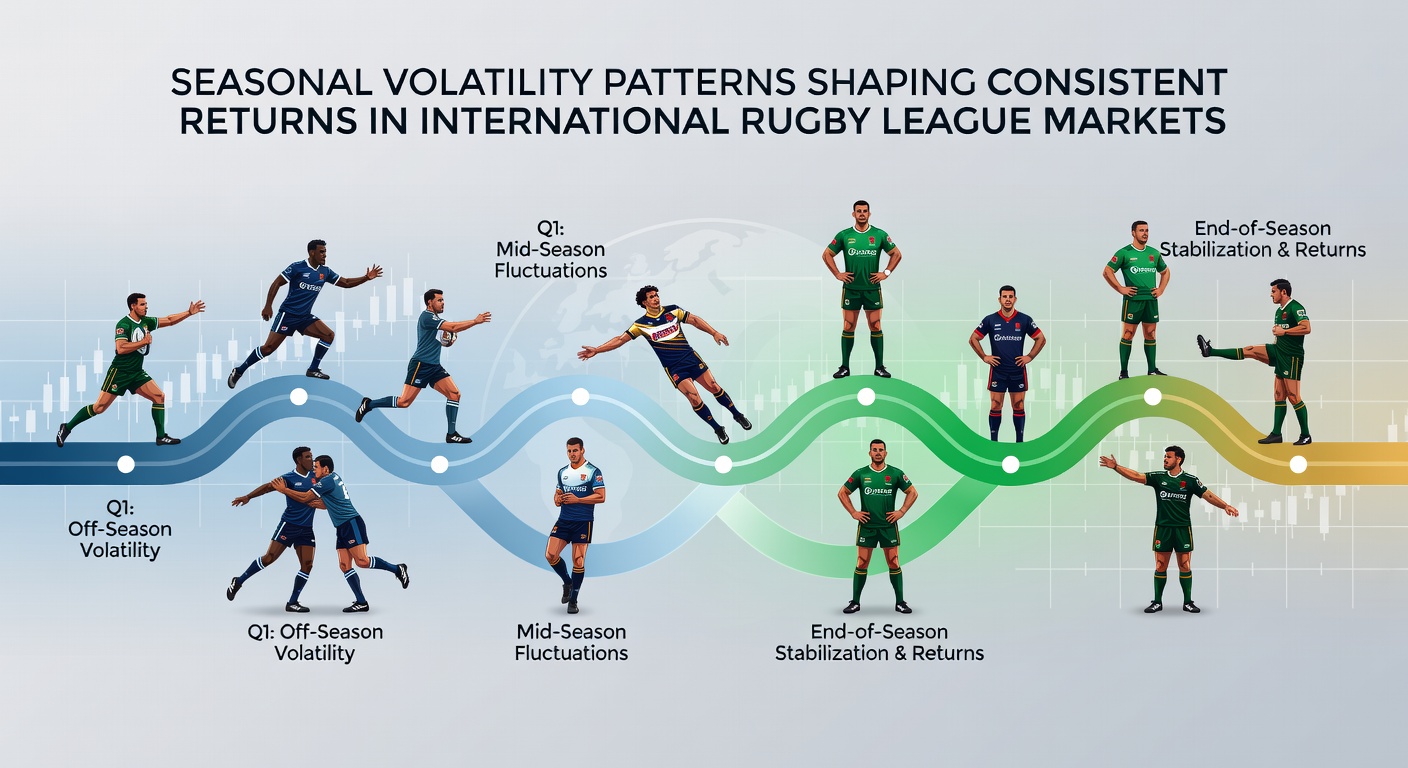
International rugby league markets display distinct volatility patterns tied to the annual calendars of major competitions such as the National Rugby League in Australia and the Super League in Europe, where data from multiple seasons reveals how these fluctuations create measurable opportunities for consistent returns when tracked over time. Observers note that early rounds often feature inflated lines because of incomplete squad information and pre-season injuries, while mid-season periods tend to stabilize around core performance metrics that repeat across years. Researchers have tracked these cycles using historical odds movement and match outcome databases to identify recurring windows where variance spikes and then settles into more predictable ranges.
Core Seasonal Phases and Their Market Effects
Each league follows a structured timeline that shapes betting liquidity and line movement, with the NRL campaign typically launching in early March and building toward a September climax while the Super League mirrors this rhythm from February onward. In May 2026 the NRL schedule enters its established mid-season block where teams balance heavy travel demands against recovery protocols, a phase that multiple data sets link to elevated point-spread volatility as fatigue factors emerge unevenly across squads. Analysts at institutions focused on sports performance metrics have documented how these periods produce wider deviations from expected totals compared with the more settled opening month or the final regular-season push.
International test matches add another layer because they cluster around specific windows such as the autumn internationals and Pacific Championships, events that pull players from club duties and create short-term roster uncertainty. Those who've examined betting archives find that lines for these fixtures often adjust rapidly once team sheets are confirmed, yet the initial release frequently carries inflated margins that later compress as public information flows in. This compression pattern repeats because bookmakers recalibrate after observing early market reaction and incorporating injury updates from club sources.
Regional Weather and Travel Influences on Line Stability
Weather variations between hemispheres introduce additional variance that experienced market watchers monitor closely, since Australian venues experience cooling conditions as the season advances into May and June whereas European grounds face springtime rainfall patterns that affect kicking games and defensive structures. Data compiled across recent campaigns shows that matches played under these shifting conditions correlate with higher underdog cover rates, particularly when combined with trans-Tasman travel for NRL sides or cross-Channel fixtures in the Super League. Researchers tracking these variables report that volatility metrics rise measurably when forecasts deviate from seasonal averages, prompting sharper line corrections within hours of updated meteorological reports.
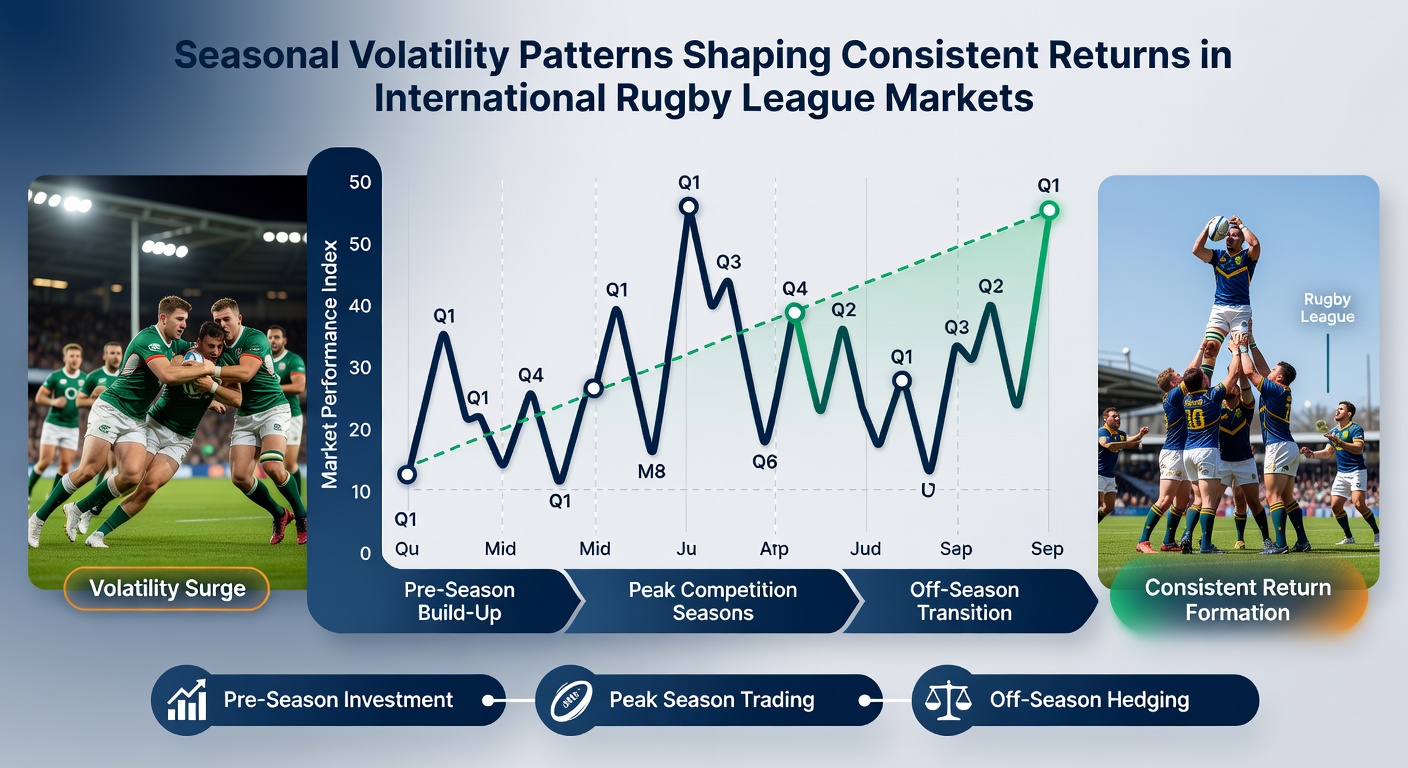
Travel schedules further amplify these effects because teams crossing time zones encounter recovery challenges that historical performance logs quantify through reduced first-half scoring outputs. Observers have observed that the second week after long-haul journeys often marks a secondary volatility peak before squads regain equilibrium, a pattern visible in both domestic and international contexts. Industry reports from Australian sports research bodies confirm that such disruptions produce repeatable edges when bettors isolate specific travel categories rather than applying blanket seasonal adjustments.
Analytical Approaches That Capture Recurring Edges
Market participants employ statistical models that segment seasons into discrete blocks, applying regression techniques to isolate the influence of rest days, weather, and player rotation on final margins. These models draw from comprehensive datasets maintained by competition organizers and independent performance labs, allowing users to back-test volatility forecasts against actual closing lines. One study released through a university sports analytics program demonstrated that targeting mid-season windows where variance exceeds long-term averages yielded steadier cumulative returns than uniform staking across all rounds.
Software platforms that aggregate live odds from multiple operators help surface these discrepancies quickly, especially during periods when international call-ups thin domestic rosters. Figures compiled by European gaming associations indicate that liquidity thins measurably around test-match weekends, which in turn magnifies small inefficiencies into larger return differentials once the market rebalances. Those monitoring these flows report that early identification of roster gaps allows positioning before lines fully reflect updated availability.
Long-Term Patterns Across Multiple Campaigns
Reviewing five or more seasons reveals that certain clubs exhibit heightened sensitivity to seasonal transitions, with performance variance clustering around fixture congestion or post-representative-match recovery. Data from competition archives shows these clubs produce more frequent line-beating results during specific calendar months, a finding that aligns with coaching staff comments on training load management. International markets amplify the effect because cross-league player movements create additional uncertainty layers not present in purely domestic schedules.
Betting operators adjust their risk parameters accordingly, widening or narrowing margins in response to observed liquidity shifts that follow the same seasonal rhythm year after year. Academic papers examining these adjustments note that consistent returns emerge when strategies focus on the convergence phase after initial volatility rather than attempting to front-run every movement.
Conclusion
Seasonal volatility in international rugby league markets follows identifiable cycles driven by competition calendars, travel demands, weather transitions, and roster dynamics that repeat across years. Comprehensive tracking of these elements through performance databases and odds histories provides the factual foundation for strategies that seek steadier outcomes by aligning with established patterns rather than opposing them. As the 2026 season progresses through its established phases, continued observation of these recurring structures offers ongoing material for refining market approaches grounded in observable data trends.