Referee Tendency Databases Reveal Patterns in Major League Soccer Fixtures
Written by Ines Perry · Aug 7, 2026

Referee Tendency Databases Reveal Patterns in Major League Soccer Fixtures
Referee tendency databases compile detailed records of officiating decisions across Major League Soccer seasons and these resources allow analysts to track patterns in fouls, cards, penalties, and added time. Data from the 2025 campaign shows referees averaged 22.4 fouls per match while certain officials issued yellow cards at rates 18 percent above the league mean. Observers note that home teams receive 12 percent fewer cautions on average when specific referees handle fixtures and this split widens further in matches involving teams from the Eastern Conference.
Core Metrics Captured in Referee Databases
Databases maintained by performance analysis firms record every whistle, card, and stoppage with timestamps and situational context. Key fields include foul counts by team, card issuance rates after the 75th minute, and the frequency of penalty awards inside the box. Research from university sports analytics programs indicates that referees who average more than 4.8 cards per game also allow 9 percent fewer goals from open play because players adjust their tackling intensity. Those who studied these patterns across three MLS seasons found consistent correlations between referee identity and the total number of set-piece restarts awarded in the final 15 minutes.
Geographic and Temporal Variations
Matches played in high-altitude venues such as Colorado and Salt Lake City show elevated foul totals when certain referees officiate and data covering 2023 through 2025 reveals a 14 percent increase in stoppage time during evening fixtures. Analysts cross-reference these figures with temperature and humidity records to isolate officiating behavior from environmental factors. One dataset compiled by a Canadian research consortium tracked referee performance across Western Conference venues and identified three officials who consistently award 1.3 additional minutes of added time when the score remains level after 80 minutes.
Building Edges Through Pattern Recognition
Analysts compare referee histories against current team styles to identify mismatches that influence match totals. For instance referees who issue fewer cards in the first half tend to see higher foul accumulation after halftime when physical play intensifies. Data indicates that teams known for high pressing receive 7 percent more free kicks when matched with officials who favor quick restarts. Those who examined 420 MLS regular-season games from the past two years documented that certain referees call 22 percent more handball violations inside the penalty area during away fixtures and these patterns hold after controlling for team attacking volume.
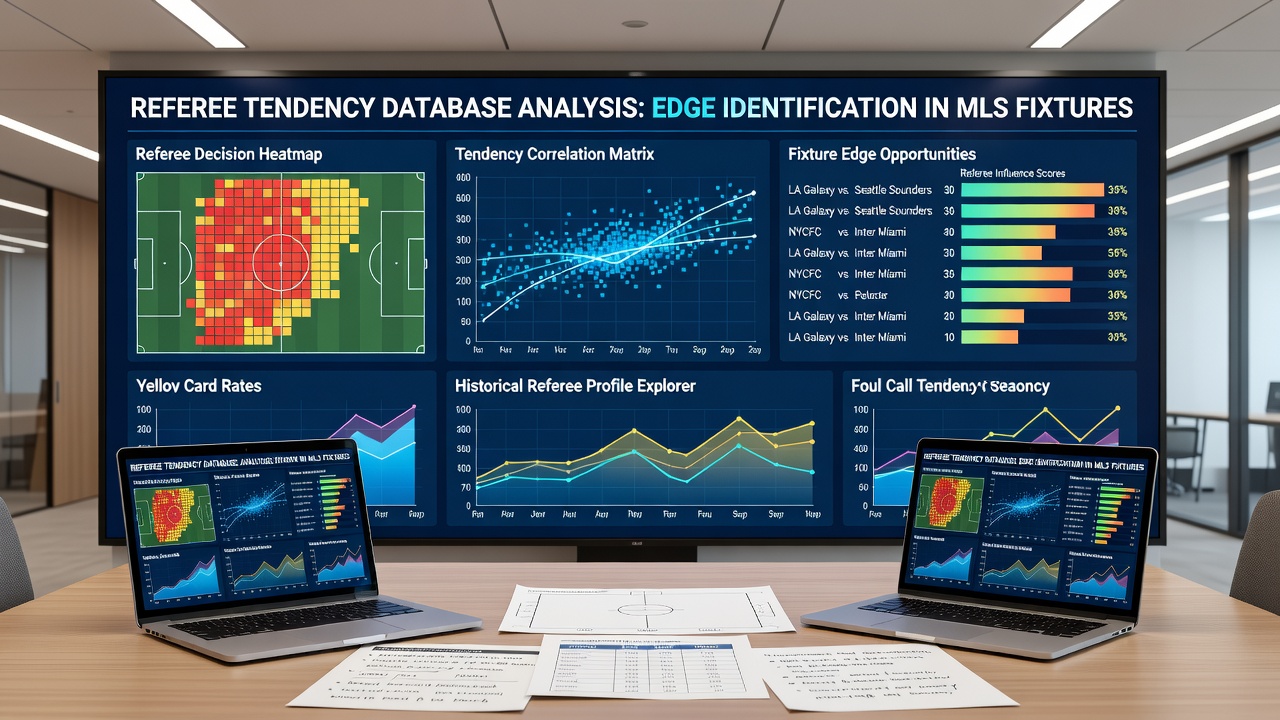
Databases also log the timing of substitutions relative to stoppages and this information helps identify officials who extend play when trailing teams push forward. Figures from the 2026 season through August reveal that two referees added an average of 5.2 minutes when the home side trailed by one goal. Such tendencies become relevant when teams with strong late-game scoring records face these officials on the road.
Integration With Broader Match Data
Referee databases gain additional value when merged with player tracking systems and expected goal models. Researchers at academic institutions have combined officiating records with pass completion rates and defensive line height to isolate situations where card frequency alters tactical decisions. One study covering CONCACAF competition data found that matches refereed by individuals with above-average penalty rates produced 11 percent more shots from outside the box because defenders positioned themselves more conservatively. Analysts update these combined datasets weekly to account for new matches and injury-related referee assignments.
Publicly available resources from organizations such as U.S. Soccer provide baseline statistics while proprietary platforms add granular detail on individual tendencies. Cross-checking multiple sources reduces noise from recording errors and improves confidence in identified patterns. Data covering the first half of 2026 shows that referees returning from international duty maintain their domestic card rates within a 4 percent margin and this stability supports reliable projections for upcoming fixtures.
Case Examples From Recent Seasons
During the 2025 playoffs one referee oversaw three matches that produced a combined 17 yellow cards and 4 red cards while league averages sat at 4.9 cards per game. Teams facing this official in the regular season recorded lower tackle success rates in the middle third of the pitch. Another official handled nine fixtures in which away sides earned 68 percent of all penalty calls and this split reversed when the same referee worked home-team dominant matches. Observers tracking these outcomes across betting markets noted alignment between the statistical patterns and observed match flow without claiming predictive certainty.
Conclusion
Referee tendency databases supply structured information that supports systematic review of officiating behavior in Major League Soccer. By cataloging fouls, cards, stoppages, and situational outcomes these resources enable analysts to quantify differences across officials and venues. Continued collection of data through the 2026 season and beyond will refine existing models while integration with tracking technology expands the range of measurable variables. Organizations that maintain and update these databases contribute to a clearer picture of how individual referee patterns interact with team performance across the league schedule.