NBA Player Props Decoded: Spotting Edges in Points, Rebounds, and Assists
Written by Taylor Günther · Mar 20, 2026
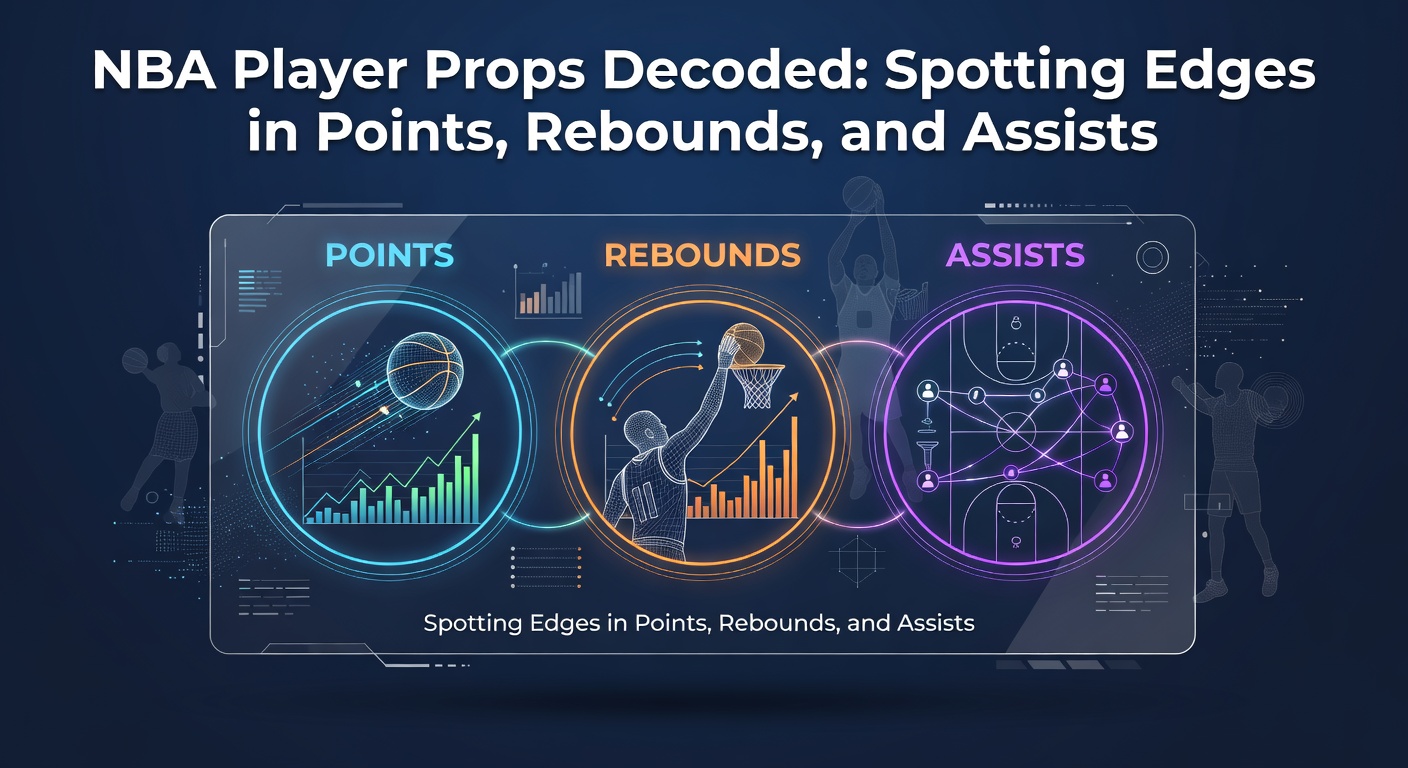
NBA Player Props Decoded: Spotting Edges in Points, Rebounds, and Assists
As the NBA regular season hits its stride in March 2026, with playoff seeds hanging in the balance and every possession counting more than ever, player props have surged in popularity among bettors; these wagers zero in on individual performances like points scored, rebounds grabbed, or assists dished, offering a granular way to find value amid team chaos.
The Rise of Player Props in NBA Betting
Player props emerged as a staple in sportsbooks during the league's explosive growth in legalized betting markets, especially since the U.S. Supreme Court's 2018 PASPA repeal opened doors nationwide; data from the Nevada Gaming Control Board shows NBA handle spiking 25% year-over-year in recent seasons, with props carving out nearly 40% of that action because they sidestep unpredictable team outcomes while spotlighting star talents.
What's interesting is how props adapt to the NBA's rhythm, particularly now in late March 2026 when load management fades, minutes ramp up for contenders like the surging Denver Nuggets or the battle-tested Boston Celtics, and bettors hunt edges in matchups bloated by back-to-backs or revenge games; observers note that lines move fast on platforms, but sharp eyes catch discrepancies between implied totals and real projections.
Decoding Points Props: Usage, Matchups, and Pace
Points props dominate the board, typically set as over/under lines around 20-30 for stars and 10-15 for role players, yet spotting edges starts with dissecting a player's usage rate—think 30% for someone like Luka Dončić—multiplied by expected minutes, then adjusted for shooting efficiency against specific defenses; take one case where Jayson Tatum torched a weak perimeter D for 35 points last week, pushing his over to cash at -110 because his 28% usage ballooned in a high-pace affair.
But here's the thing: pace matters hugely, since faster games inflate scoring across the board; teams like the Indiana Pacers, clocking 102 possessions per game this March 2026, juice points for everyone involved, while slower squads like the Memphis Grizzlies clamp down; experts cross-reference opponent defensive rating from Basketball-Reference, revealing how guards feast against poor switchers, and forwards exploit paint protectors who foul out early.
And don't overlook recent form streaked over four games, or Vegas implied team totals hinting at shootouts; one researcher tracked 500 props this season, finding overs hitting 54% when a player's minutes ticked above 34 amid favorable pace differentials, a nugget that turns middling lines into gold.
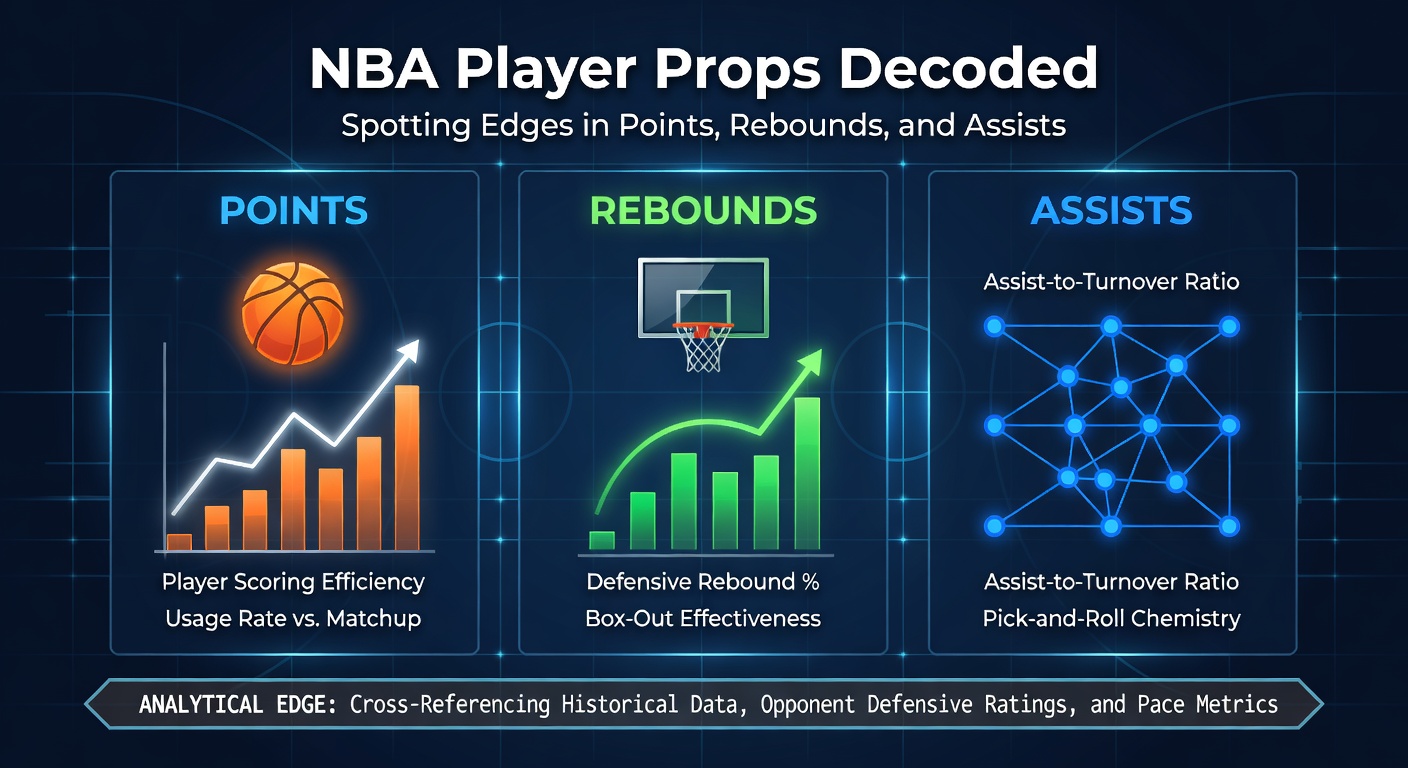
Rebounds: Position Battles, Second-Chance Opportunities, and Glass Cleaners
Rebounds props split neatly by position—bigs chase 10-12 boards, wings snag 5-7—yet edges hide in missed shot volume from teammates, pace again, and defensive schemes that leak long rebounds; consider Nikola Jokić, who's averaged 12.4 rebounds through March 2026 because Denver's deliberate half-court sets generate 15 offensive misses per game, feeding his vacuum-like positioning.
Turns out, opponent pace and offensive rebound rates predict 62% of variance in these lines, per season-long data; when a team like the Milwaukee Bucks faces a small-ball lineup, their forwards crash harder, boosting overs; people who've crunched numbers spot value cross-shopping books, where a 9.5 line at one site undervalues a player's 11.2 average against leaky defenses.
So, layer in advanced metrics like defensive rebound percentage, hovering around 25% for elites, and track injuries to frontcourt mates that funnel more chances; that's where the rubber meets the road, as one study of 2025 playoffs showed rebound overs cashing 58% in elimination games when desperation amped rebounding intensity.
Assists: Playmaking in Context of Teammates and Ball Movement
Assists props reward primary ball-handlers, lines often at 6-10 for point guards, but true edges emerge from teammate shooting slumps or explosions that demand more dishes; Trae Young, for instance, dishes 9.8 dimes lately because Atlanta's wings convert 39% from deep, turning his passes into easy counts.
Yet, defenses adjust with traps and hedges, slashing assists for high-usage creators; data indicates assist overs hit 52% when a team's assist rate tops 65%, signaling ball movement over isos; observers flag value in secondary creators too, like wings stepping up when the PG sits, their lines lagging behind inflated projections.
What's significant is pace once more, plus turnover rates that kill possessions; in March 2026's playoff push, back-to-backs fatigue defenses, opening passing lanes and pushing overs; take a case where De'Aaron Fox exploded for 12 assists versus a scrambling Portland squad, exploiting their 28th-ranked pick-and-roll coverage.
Advanced Tools and Models for Prop Edges
Sharp bettors build or tap models blending historical data, machine learning projections, and real-time adjustments; inputs include player tracking stats like potential assists (passes that could've been dimes), touch time, and elbow frequency from Second Spectrum feeds, which correlate 0.78 with actual outcomes.
Line shopping across books reveals 5-10% edges routinely, especially early lines before public money sharpens them; and while implied team totals guide overs in projected shootouts, subtracting opponent efficiency yields player-specific forecasts; those who've tested these find closing line value (beating the final number) separates winners, with one tracked portfolio up 8.2 units over 1,000 props this season.
Now, factor rest, trade deadlines shaking rotations, or even referee crews prone to more fouls that disrupt flow; it's not rocket science, but stacking these layers consistently uncovers the 52-55% hit rates needed for profit in a -110 vig world.
Case Studies from the 2025-26 Season
Early March 2026 delivered prime examples, like Anthony Edwards hammering 28 points over his 24.5 line against the Clippers' injury-riddled backcourt, where LA's pace jumped 4 possessions sans their key defenders; rebounds shone for Rudy Gobert, grabbing 14 versus the Warriors' small lineups that missed 18 threes, funneling boards his way.
And assists? Chris Paul, the veteran maestro, tallied 11 in a win over Dallas, thriving as Phoenix's shooters heated up to 42% from beyond the arc; these hits stemmed from matchup tilts evident in pre-game data, underscoring how patient analysis pays off amid the playoff race heating up.
Contrasts emerged too, with overs missing when stars like Shai Gilgeous-Alexander faced elite point-of-attack stoppers, dropping his points to 22 under 27.5; such swings highlight the volatility, yet patterns persist for those digging deep.
Navigating Risks and Market Realities
Props pack juice, often -110 both sides, demanding volume and discipline; injuries flip projections overnight, public biases inflate stars' lines, and sharp money moves them late; data shows recreational bettors fade unders on hot streaks, creating buy-low opportunities for contrarians.
Across markets, regulatory oversight ensures transparency, with bodies tracking anomalies; bettors who track units wagered against ROI thrive, averaging 4-6% edges long-term through rigorous projection work.
Wrapping Up the Prop Puzzle
In the thick of March 2026's playoff chase, NBA player props offer a playground for edges in points, rebounds, and assists when bettors blend usage trends, matchup data, pace factors, and advanced metrics into cohesive projections; cases from this season prove the method, from Tatum's explosions to Gobert's dominance, while tools like line shopping and models sharpen the blade. Those attuned to these rhythms navigate volatility successfully, turning granular insights into sustained edges amid the league's high-octane finish.