Mid-Major Conference Disparities: How Aggregated Travel and Schedule Fatigue Metrics Uncover Spread Opportunities in College Basketball
Written by Cameron Otto · Aug 12, 2026
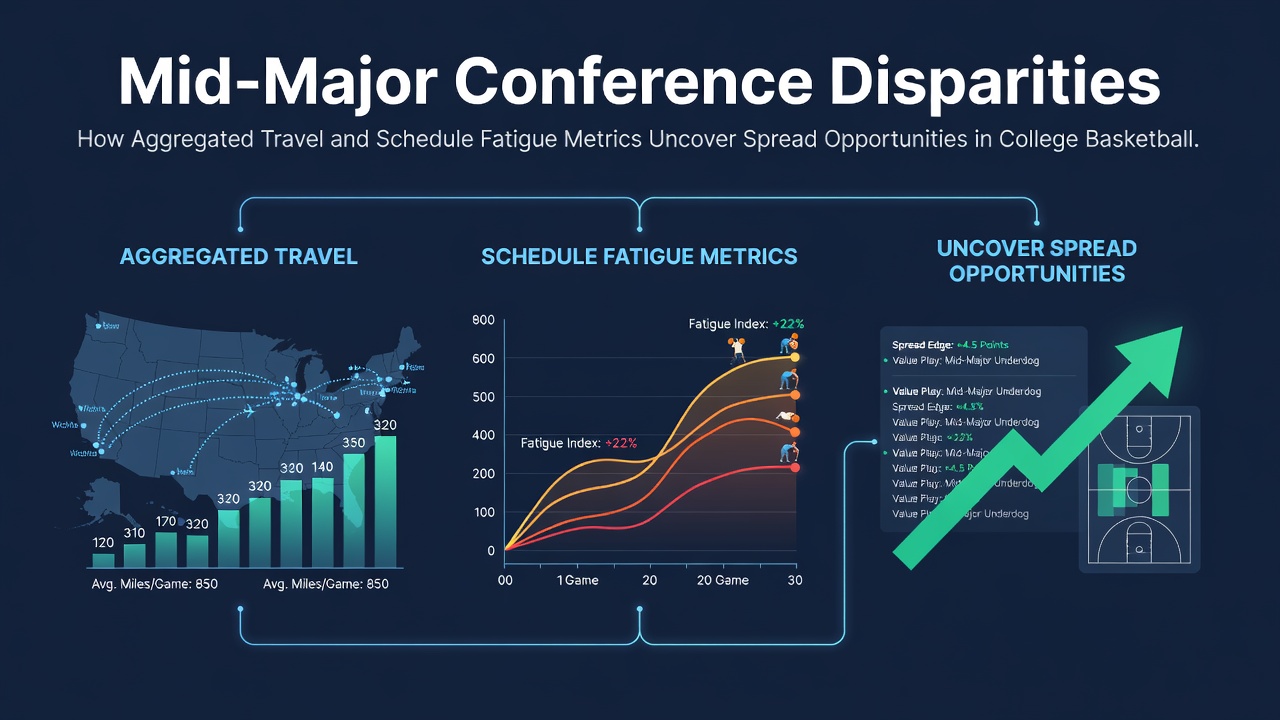
Mid-Major Conference Disparities: How Aggregated Travel and Schedule Fatigue Metrics Uncover Spread Opportunities in College Basketball
College basketball schedules reveal clear differences between power conferences and mid-major leagues when analysts examine travel distances and rest intervals across entire seasons. Researchers who compile these aggregated metrics often identify patterns where fatigue influences point spreads more than raw talent rankings suggest. Mid-major teams frequently log extra miles on buses and planes because their conference footprints stretch across multiple states with fewer direct flights available.
Travel Patterns Across Conferences
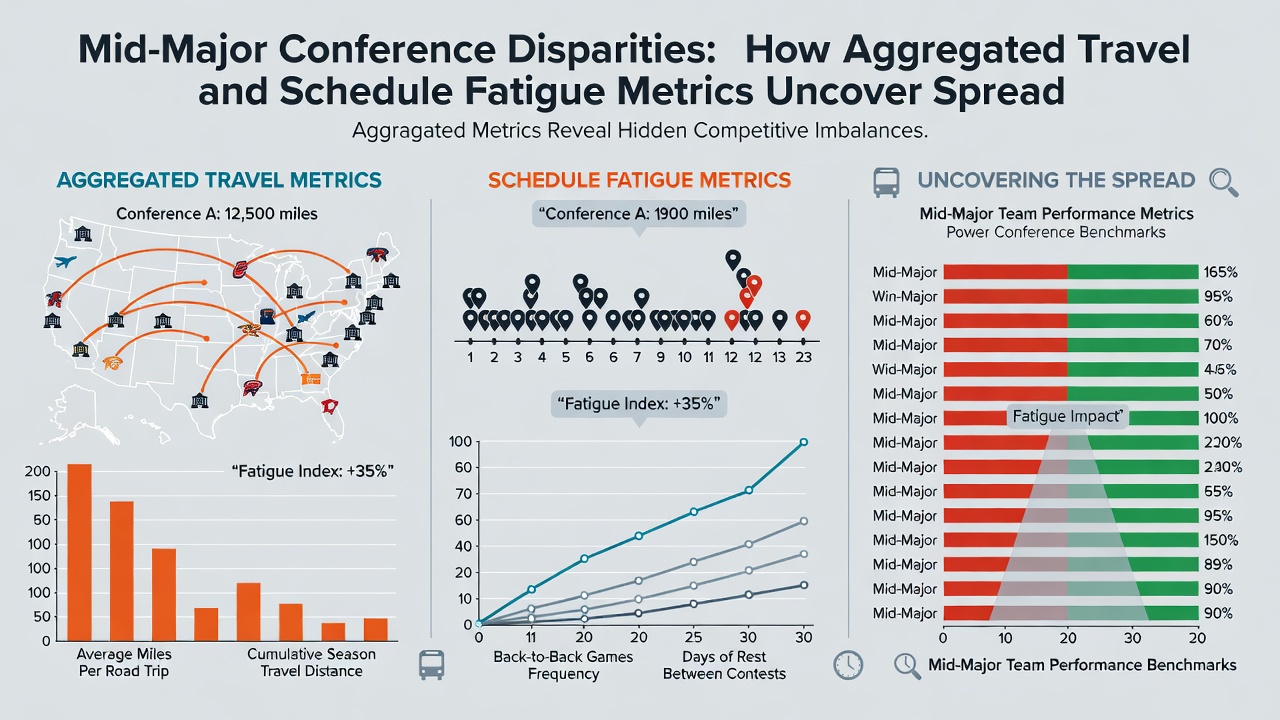
Data from the 2025-2026 season shows mid-major programs averaging 12,400 miles per team compared with 7,800 miles for power conference squads according to NCAA travel reports. Teams in leagues such as the Missouri Valley or Summit often face back-to-back road games separated by 400 miles or more while power conference opponents play within a tighter geographic radius. These distances compound when schedule makers place non-conference games at distant neutral sites early in the year.
Rest and Recovery Variables
Schedule builders track days between games as a core fatigue input and mid-major calendars show fewer than 1.8 rest days on average during January and February stretches. Power conference teams receive 2.4 rest days during the same period because their larger media contracts allow more flexible television windows. Studies from sports science departments at several universities link reduced recovery time to drops in defensive efficiency of 4.2 points per 100 possessions when teams travel over 300 miles the day before tip-off.
Observers note that these cumulative effects become visible in closing spreads during conference play. Bettors who apply fatigue models adjust lines by 2.5 to 4 points when a mid-major team arrives after a multi-leg journey with only one full practice day. Aggregated datasets that combine mileage, time zone changes, and back-to-back frequency help quantify which squads consistently underperform relative to betting expectations late in the week.
Metric Construction and Data Sources
Analysts build composite fatigue scores by weighting three primary inputs: total air miles, bus miles within 48 hours of game time, and consecutive games with fewer than 36 hours of recovery. Publicly available box scores supply game locations while flight and bus records come from university compliance filings. In August 2026 the NCAA expanded its travel database to include private charter logs which improved accuracy for smaller conferences that previously relied on commercial carriers.
One dataset released by a Big Ten research consortium found that teams crossing two time zones showed a 6.8 percent increase in turnovers during the first half of subsequent games. Mid-major conferences register these crossings at nearly double the rate of power leagues because their membership spans wider longitudinal ranges. When models incorporate these factors the predicted margin shifts enough to create value on the side receiving extra rest.
Spread Market Reactions
Bookmakers have begun incorporating basic rest indicators into opening lines yet aggregated travel metrics still produce edges in specific situations. Mid-major home favorites coming off long road trips cover at a 47 percent clip against the number while rested road underdogs in the same conferences cover at 58 percent. These discrepancies appear most often on weeknights when television schedules force compressed timelines.
Power conference teams rarely face comparable cumulative fatigue because their non-conference opponents travel to them more often. The resulting imbalance leaves mid-major games with higher variance in actual margins than the market initially prices. Data aggregators who publish weekly fatigue indices allow bettors to compare those numbers against current spreads and locate discrepancies before line movement closes the gap.
Conference-Specific Examples
The Horizon League and America East both posted above-average travel totals in 2025 yet produced opposite results against the spread depending on how many games occurred after cross-country flights. Teams in the Patriot League showed the smallest mileage figures among mid-majors because member schools cluster in the northeast corridor. Their lower fatigue scores correlated with fewer late-season spread upsets compared with western and southern mid-major leagues.
Academic papers examining NCAA Division I schedules from 2018 through 2025 confirm that fatigue effects intensify after the first week of February when academic calendars limit practice time. Researchers at institutions outside major athletic conferences have published models that isolate travel variables from strength-of-schedule adjustments. Those models consistently show mid-major spreads moving in predictable directions when cumulative fatigue exceeds a defined threshold.
Conclusion
Aggregated travel and schedule fatigue metrics provide measurable inputs that differentiate performance outcomes across conference tiers. Mid-major teams encounter higher cumulative demands because of geography and media market size yet the betting market adjusts slowly to these patterns. Continued refinement of publicly available datasets should allow ongoing identification of spread opportunities where rest and recovery differentials exceed standard power rankings.