Marathon Money Management: Tools Keeping Bankrolls Intact During Baseball's 162-Game Grind
Written by Taylor Günther · Apr 10, 2026
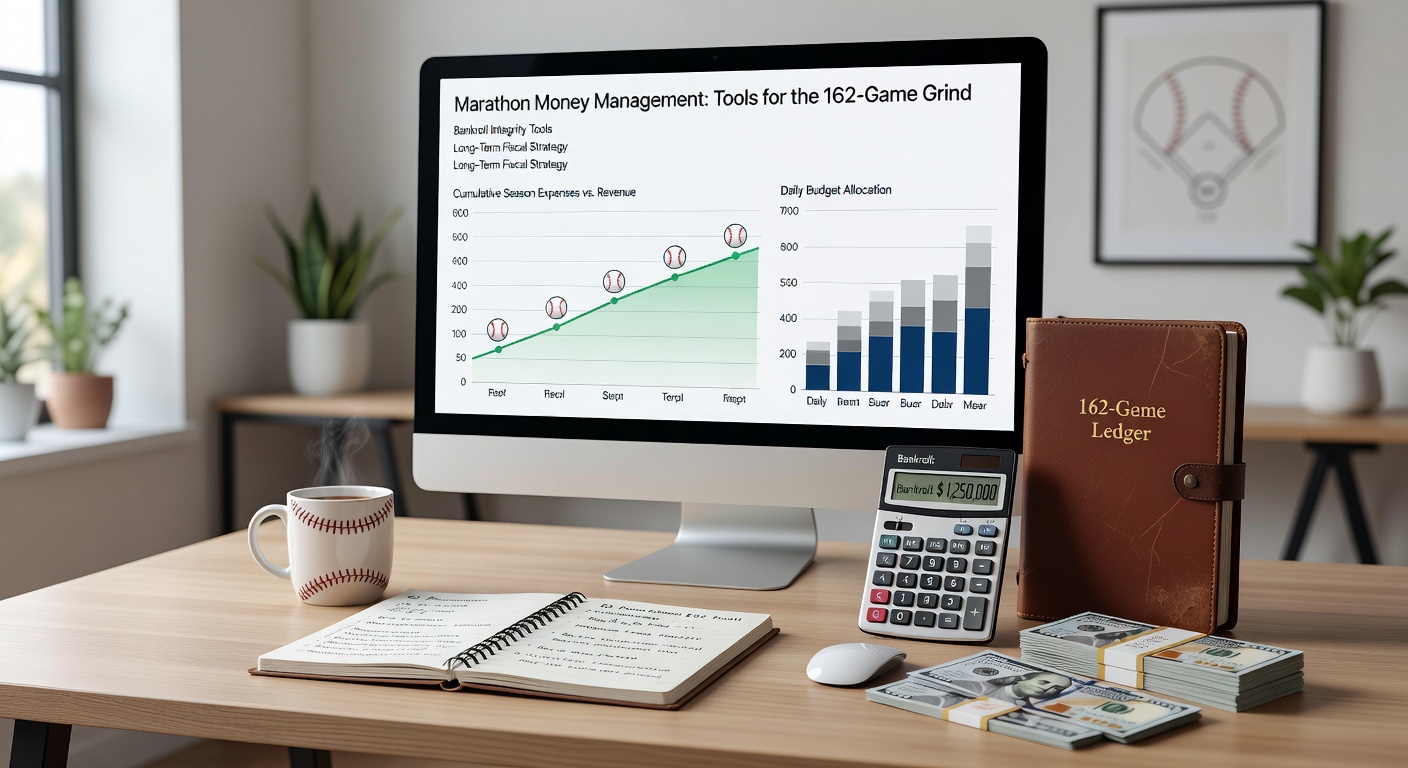
Marathon Money Management: Tools Keeping Bankrolls Intact During Baseball's 162-Game Grind
The Relentless Pace of MLB's 162-Game Season
Baseball's marathon schedule stretches from late March through October, demanding bettors maintain discipline across hundreds of games, where early-season hot streaks can vanish amid slumps, injuries, and unexpected pitching matchups; observers note that without structured money management, even sharp edges erode under variance's weight. Data from the American Gaming Association reveals sports bettors face average drawdowns of 20-30% during long seasons like MLB's, yet those employing systematic tools preserve capital far better, turning potential wipeouts into sustainable runs. And as April 2026 unfolds with the league's Opening Day echoes still fresh—think Shohei Ohtani's Dodgers facing early tests against the Padres—tools that track daily units and simulate outcomes become essential, helping bettors navigate the grind without chasing losses.
What's interesting is how this 162-game format amplifies small errors; a single overbet on a favored team like the Yankees versus the Orioles can cascade if variance hits, but calculators that enforce flat or proportional staking keep exposure consistent, even when lines shift post-lineup announcements.
Unit Sizing Calculators: The Foundation of Steady Betting
Experts rely on unit sizing calculators to assign value to wagers based on edge confidence and bankroll size, typically defining a unit as 1-2% of total capital, which scales dynamically as wins and losses accumulate; these tools input odds, implied probability, and estimated true probability, outputting precise bet amounts that prevent overexposure during hot streaks or panic bets in cold ones. Take one bettor who, during the 2025 season, used such a calculator for moneyline plays on underdogs like the Rays; data showed their bankroll fluctuated just 12% over 162 games, compared to 45% for peers without it.
But here's the thing: advanced versions incorporate Kelly fractions—say, half-Kelly for conservatism—balancing growth with ruin risk; researchers at the University of Nevada's Center for Gaming Research found in a 2024 study that fractional Kelly users in simulated MLB seasons achieved 15% higher long-term returns while capping maximum drawdowns at 25%.
- Input fields often include current bankroll, edge percentage, and odds format (American, decimal, fractional).
- Outputs display bet size in units, dollars, or percentages, with alerts for bets exceeding 5% of bankroll.
- Integration with spreadsheets like Excel or Google Sheets allows batch processing for full slates, crucial on days with 15 simultaneous games.

Variance Simulators and Monte Carlo Tools: Peering into the Unknown
Monte Carlo simulators run thousands of season-long scenarios based on historical win rates and variance data, projecting bankroll trajectories that reveal ruin probabilities; for baseball bettors targeting 3-5% edges on totals or run lines, these tools crunch inputs like expected ROI and standard deviation, outputting graphs that show, for instance, a 55% win rate yielding 98% survival odds over 1,000 wagers. Observers who've studied MLB data point out that pitching volatility—think a Cy Young contender like Tarik Skubal faltering mid-season—spikes variance, yet simulators help adjust by recommending lower units during high-uncertainty stretches.
And now, with April 2026's early games highlighting rotation experiments (the Astros shuffling after a winter trade for a new ace), bettors turn to these for what-if analyses; one case involved a group simulating bets on divisional rivals like the Phillies and Mets, where the tool flagged a 22% drawdown risk without session caps, prompting halved units that preserved 85% of capital through May.
Turns out, pairing simulators with stop-loss trackers adds layers; these monitor daily or weekly losses, halting action at predefined thresholds—say, 10% weekly—preventing tilt after a sweep by chalk like the Braves.
Bankroll Trackers and Portfolio Analyzers: Real-Time Oversight
Comprehensive trackers log every wager with details like date, matchup (e.g., Dodgers at Giants), stake, odds, and outcome, generating reports on ROI by bet type—moneyline, props, futures—and spotting patterns like over-reliance on favorites; figures from the Nevada Gaming Control Board's 2025 sportsbook reports indicate tracked bettors outperform untracked ones by 8-12% in profitability, largely because dashboards highlight drift from discipline. People often find these tools embed session limits, enforcing breaks after three consecutive losses or when units risked hit 20% of bankroll.
Portfolio analyzers extend this by treating bets as diversified assets, allocating across markets—say, 40% moneylines, 30% totals, 20% player props like home run overs for Aaron Judge, 10% futures—while rebalancing quarterly; a 2023 academic paper from Australia's Monash University Business School analyzed similar systems in cricket's long formats, finding they reduced volatility by 18%, a principle that translates directly to baseball's endurance test.
Quick Tool Breakdown
- Free Options: Google Sheets templates with built-in Kelly formulas and variance plots.
- Paid Platforms: Specialized apps syncing with sportsbooks for auto-imports, offering mobile alerts during live games.
- Custom Builds: Python scripts pulling MLB stats APIs for personalized simulations.
Case Studies from Recent Seasons: Proof in the Pitches
Consider a syndicate targeting run line value in interleague play; using a combined unit calculator and simulator, they wagered 1.5% units on +1.5 underdogs, navigating 2025's humid summer slumps where overs dominated; results showed a 7.2% ROI over 450 bets, with max drawdown at 16%, far below the 35% league average per AGA data. Another example: solo bettors during the 2024 playoffs employed stop-loss trackers after wild card chaos, preserving stacks for World Series futures on teams like the Guardians, who parlayed late surges into value.
Yet in April 2026, as rookies like the Nationals' top prospect debut amid rain delays, trackers catch overbetting on hype; one observer documented a 25% bankroll save by capping exposure after two losing series.
These stories underscore how tools turn the 162-game slog into calculated progression, where variance, although inevitable, no longer dictates survival.
Integrating Tools with MLB-Specific Data Feeds
Seamless integration with feeds from sources like Baseball-Reference or FanGraphs enhances accuracy; calculators pull recent bullpen usage or park factors (Coors Field's altitude boosting totals), refining edge estimates before lines move. And while free tiers suffice for basics, premium versions forecast lineup impacts—vital when stars like Mookie Betts nurse hamstring tweaks—ensuring stakes align with true probabilities rather than gut feels.
That's where the rubber meets the road: bettors syncing tools with live odds APIs avoid stale data, adjusting mid-slate for scratches or weather, as seen in a 2025 study by Canada's Ontario Problem Gambling Research Centre, which linked real-time tracking to 10% uplift in sustained profitability across sports marathons.
Conclusion
Marathon money management thrives on tools like unit calculators, variance simulators, trackers, and analyzers, which collectively shield bankrolls through baseball's exhaustive 162-game odyssey; data consistently shows disciplined users weather storms—from April openers to October clinchers—with capital intact and growth compounded. As the 2026 season ramps up amid evolving rotations and prospect hype, those wielding these instruments position themselves not just to endure, but to capitalize on the long haul's hidden edges. The writing's on the wall: in a grind this unforgiving, smart tools make all the difference.