Mapping Variance Trends in Minor League Baseball Totals to Optimize Bet Sizing Formulas
Written by Cameron Otto · Jul 24, 2026

Mapping Variance Trends in Minor League Baseball Totals to Optimize Bet Sizing Formulas
Minor league baseball totals markets present distinct variance structures that differ from major league counterparts because lower-level games feature inconsistent pitching staffs, variable weather impacts across regions, and fluctuating offensive outputs tied to player development cycles. Observers note that these factors create measurable swings in run totals, and analysts track those swings through historical data sets to adjust position sizing formulas accordingly.
Core Components of Totals Variance in MiLB
Run totals in Class A through Triple-A contests show higher standard deviations than big-league equivalents, with data from the 2025 season indicating average game totals ranging from 9.2 to 11.8 runs depending on league and park factors. Researchers at sports analytics firms compile play-by-play records to isolate variance spikes that occur when starting pitchers face lineups lacking major-league experience, while bullpen usage patterns add further dispersion because minor league teams often experiment with arm development rather than strict win optimization.
Those who model these markets separate variance into two layers: game-level volatility driven by individual matchups and series-level clustering caused by travel schedules or weather fronts. Charts that plot rolling 30-game windows reveal periods when totals deviate sharply from league averages, and position sizing models incorporate these deviations by scaling wager amounts downward during high-variance windows and increasing them when distributions tighten.
Data Collection Methods and Tools
Statisticians gather raw totals data from official league scorebooks and cross-reference them with park-adjusted run environments published by organizations such as Baseball America. Software platforms then apply regression techniques to isolate the contribution of each variable, including altitude effects in high-desert venues and humidity influences in Gulf Coast leagues. The resulting variance coefficients feed directly into Kelly-inspired sizing formulas, where bettors replace static fractional stakes with dynamic percentages that shrink when recent totals exhibit elevated dispersion.
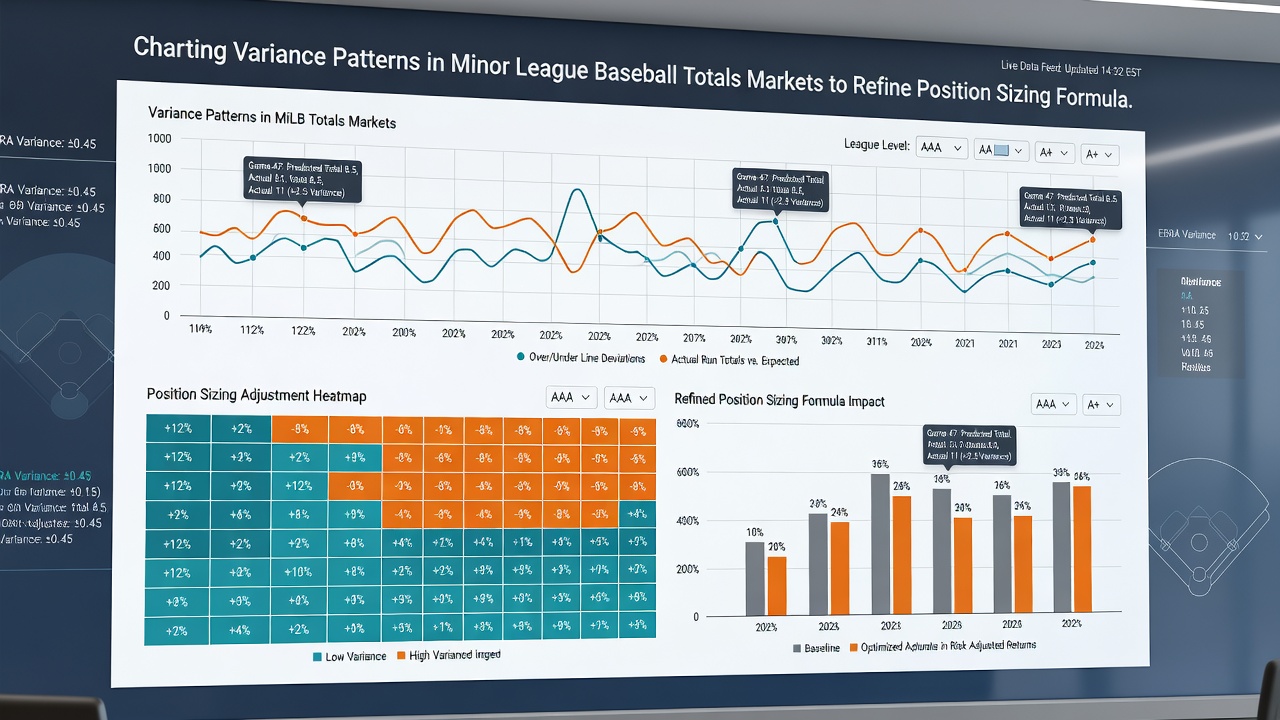
July 2026 updates to several minor league scheduling databases added granular pitch-count tracking that allows models to detect fatigue-driven variance earlier in homestands. Analysts integrate these feeds into spreadsheets that recalculate expected value and recommended stake sizes on a nightly basis, producing outputs that reflect both historical volatility and current roster conditions.
Refining Position Sizing Formulas
Traditional fixed-fraction betting assumes relatively stable variance across similar markets, yet minor league totals frequently violate that assumption. Position sizing formulas therefore incorporate a volatility multiplier derived from the standard deviation of the prior 20 comparable games. When that multiplier exceeds a preset threshold, the formula reduces stake size by a proportional factor to preserve bankroll during outlier sequences.
Case examples from the 2024 and 2025 seasons illustrate the approach. One Midwest League series produced totals with a standard deviation 35 percent above the seasonal norm, prompting models to cut recommended units from 2.5 percent to 1.4 percent of bankroll. Subsequent games reverted toward the mean, and the adjusted sizing preserved capital that larger fixed stakes would have risked. Researchers compare these outcomes against control groups that used static sizing to quantify the reduction in drawdown magnitude.
Integration with Market Movement Data
Line movement records from multiple sportsbooks provide an additional signal because sharp action often compresses or expands totals variance in predictable ways. When early limits move totals by more than half a run within the first hour of release, historical patterns show subsequent game results cluster more tightly around the adjusted number. Models that blend this movement data with variance charts adjust position sizes upward when compression is detected and downward when lines remain static yet underlying volatility metrics remain elevated.
External validation comes from academic papers on sports market efficiency, including work published by the Social Science Research Network that examines pricing discrepancies in lower-tier baseball markets. Those studies supply benchmark variance estimates that practitioners calibrate against real-time minor league data feeds.
Practical Implementation Steps
Teams and individual bettors begin by exporting totals and closing lines into a database that tags each game with league, venue, and starting pitcher quality metrics. Custom scripts then calculate rolling variance statistics and feed them into a sizing engine that outputs recommended units for the next slate. Weekly reviews compare actual outcomes against model projections, allowing incremental tweaks to volatility thresholds without altering the core formula structure.
Additional calibration draws on injury reports and weather services that supply probability distributions for temperature and precipitation. These inputs modify the baseline variance coefficient before position sizing occurs, ensuring formulas reflect both statistical history and environmental conditions expected on a given date.
Conclusion
Charting variance patterns in minor league baseball totals markets supplies quantitative inputs that refine position sizing formulas beyond static percentage approaches. Data sets compiled through 2026 demonstrate measurable improvements in capital preservation when models scale stakes according to observed dispersion rather than fixed rules. Continued collection of granular statistics, combined with integration of line movement and environmental factors, sustains the accuracy of these adjustments across changing minor league schedules.