Mapping Athlete Biometrics to Real-Time Market Movements in Team Sports Betting
Written by Klara Krause · Jul 1, 2026
Mapping Athlete Biometrics to Real-Time Market Movements in Team Sports Betting
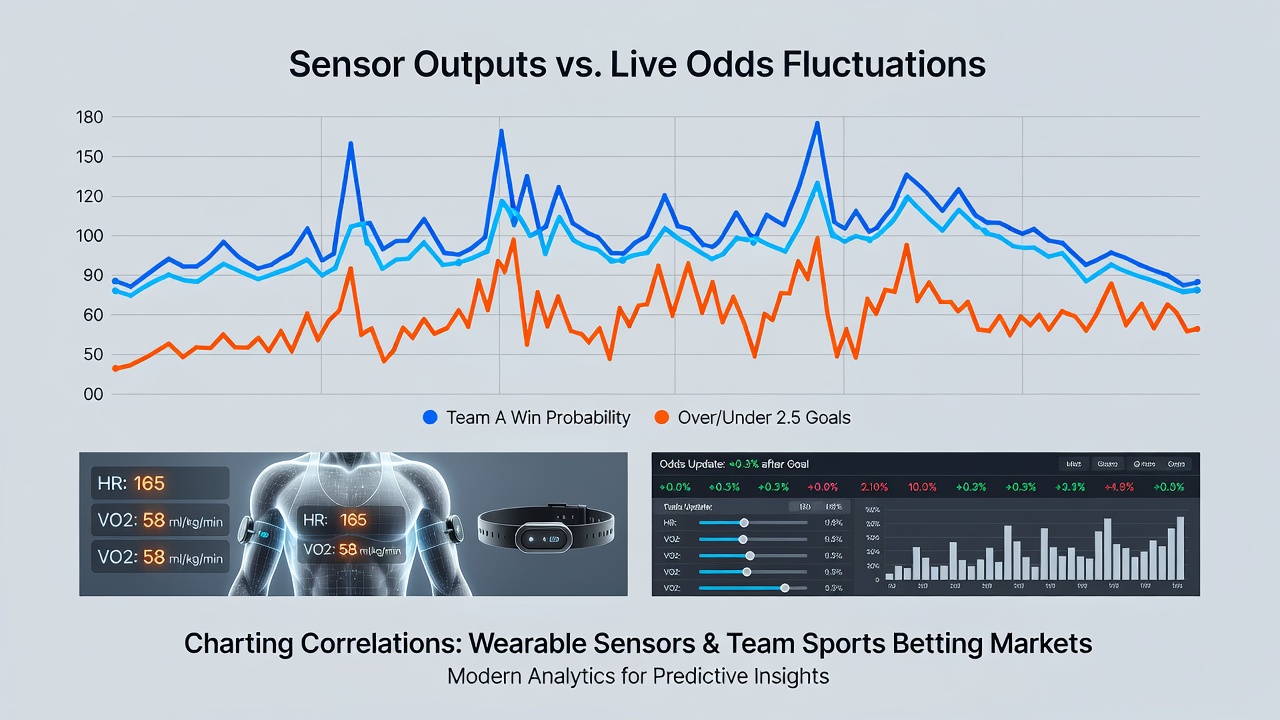
Professional teams across multiple leagues have integrated wearable sensors into daily training and match routines for years, and these devices generate continuous streams of data on heart rate variability, acceleration forces, and positional workloads. Live betting markets respond to in-game events with rapid odds adjustments, creating opportunities to examine whether biosensor outputs align with those price shifts in measurable ways. Analysts collect timestamped sensor readings alongside order book changes from betting exchanges, then apply statistical models to identify patterns that repeat across dozens of fixtures.
Core Components of Wearable Data Collection
Devices such as GPS-enabled vests and chest-strap monitors record metrics at frequencies up to 100 hertz, capturing parameters that include total distance covered, high-speed running bouts, and player load scores derived from triaxial accelerometers. Teams transmit anonymized aggregates to performance staff in real time, while third-party platforms aggregate similar feeds from multiple squads for comparative analysis. Researchers cross-reference these values against external factors like temperature and fixture congestion to isolate signals that might precede shifts in team totals or player prop lines.
Mechanics of Live Odds Adjustments
Bookmakers and exchange operators update prices continuously during matches using algorithms that weigh scoreline changes, time remaining, and historical tendencies. When a key midfielder records elevated heart-rate zones or reduced sprint outputs, market participants monitoring injury feeds or team communications sometimes place bets that nudge lines before the information becomes widely known. Data pipelines now ingest sensor-derived fatigue indicators alongside traditional statistics, allowing automated systems to flag potential correlations within seconds of each new reading.
Documented Patterns Across Leagues
Studies tracking elite soccer matches found that teams whose players exceeded individualized load thresholds in the first half showed measurable increases in over-line activity for second-half goal markets. Similar observations emerged in basketball, where elevated player-load readings from starting guards correlated with movements in assist and rebound props during subsequent quarters. Observers note that these relationships strengthen in high-stakes playoff environments where coaching staffs rely more heavily on biometric dashboards to manage rotations.
Analytical Techniques Applied to the Datasets
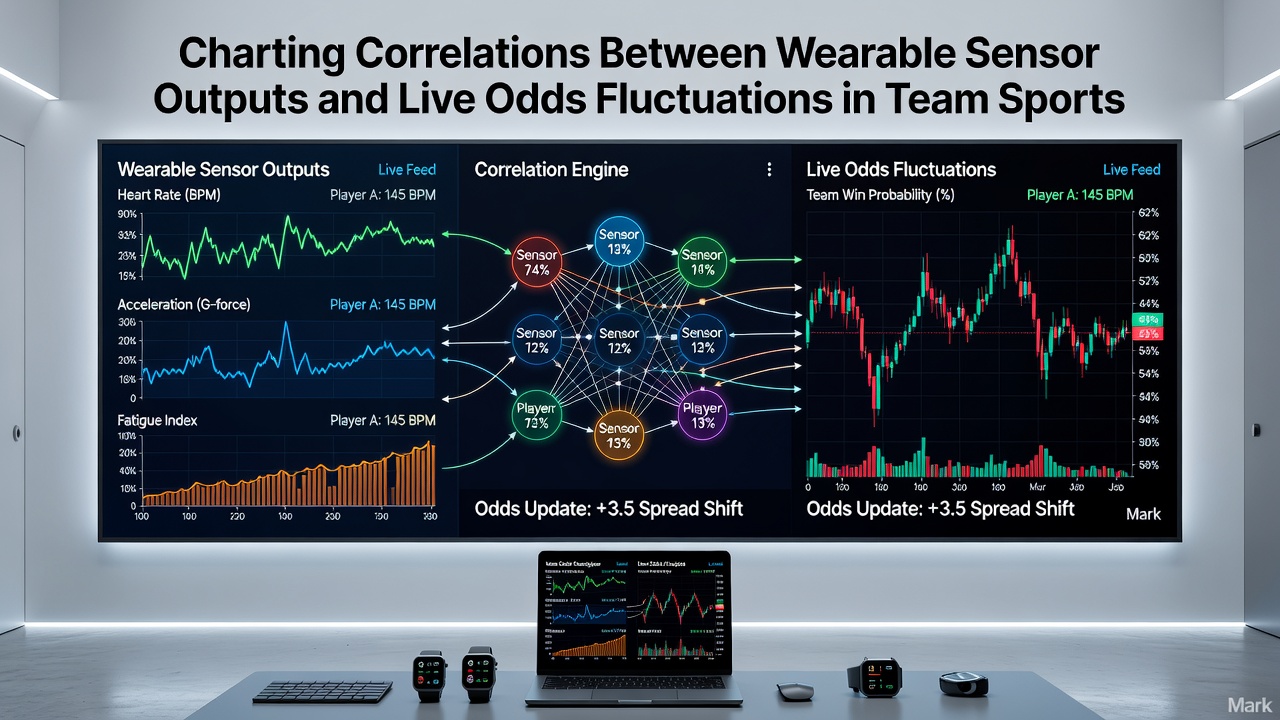
Statisticians employ lagged regression models that align sensor timestamps with odds-change events recorded at millisecond precision on betting exchanges. Vector autoregression frameworks help separate sensor-driven signals from confounding variables such as weather or referee assignments. Cross-validation across multiple seasons reduces overfitting, while clustering algorithms group matches by sport-specific workload profiles to improve predictive stability. Outputs from these models appear in proprietary dashboards used by quantitative trading desks and academic research groups alike.
Integration Timelines and 2026 Developments
By July 2026 several European data consortia had established standardized APIs that merge anonymized biometric feeds with live market data streams under strict consent protocols. North American leagues followed with pilot programs that granted approved analytics partners access to normalized workload scores during regular-season contests. These integrations reduced latency between sensor capture and market-signal detection from minutes to sub-second intervals, allowing more granular examination of micro-movements in live spreads and totals.
One research collaboration between a Canadian university sports science department and an Australian betting analytics firm published findings showing consistent associations between acute workload spikes and subsequent total-points line movements in basketball. Their dataset encompassed more than 800 games across two continents, with correlation coefficients remaining stable after controlling for score differential and time on court.
Limitations and Data-Quality Considerations
Not every sensor metric translates directly into market-relevant information, since teams vary in how they interpret and act upon biometric alerts. Sampling rates differ between device manufacturers, and packet loss during wireless transmission can introduce gaps that analysts must impute. Privacy regulations further restrict the granularity of publicly available datasets, compelling researchers to work with aggregated or permissioned feeds that may mask individual player identities.
Conclusion
Systematic charting of biosensor outputs against live odds fluctuations has evolved from exploratory analysis into a structured field supported by standardized data protocols and multi-season validation studies. As integration platforms mature, the volume of aligned observations continues to expand, offering clearer visibility into which physiological markers precede measurable price adjustments in team sports markets. Continued refinement of statistical controls and broader league participation will determine how precisely these correlations can be quantified going forward.