Exploring Underdog Performance Patterns in College Football Conferences Through Archival Data
Written by Cameron Otto · Jun 28, 2026
Exploring Underdog Performance Patterns in College Football Conferences Through Archival Data
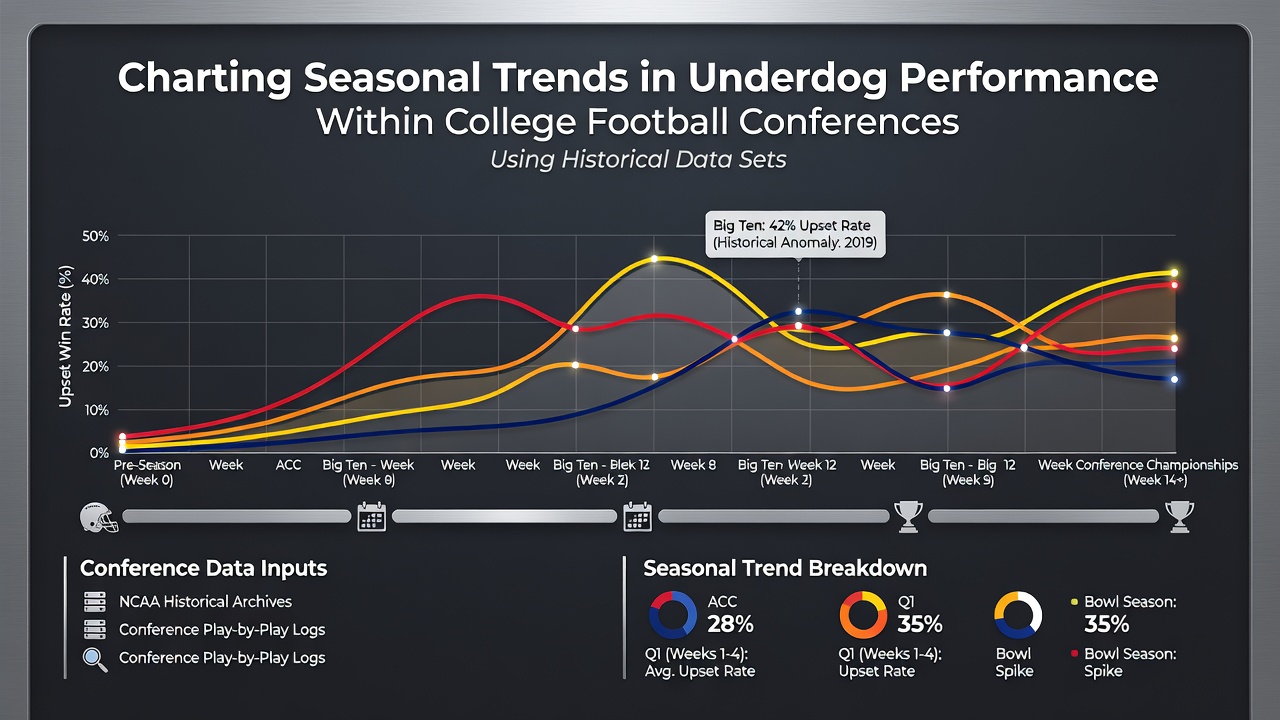
Researchers have examined decades of game results to identify recurring patterns in how underdogs perform within conferences such as the Big Ten, SEC, ACC, and Big 12, drawing from comprehensive historical data sets maintained by the NCAA and university athletic departments. Data from 1980 onward reveals that underdog teams achieve higher success rates in conference play during the middle weeks of the season compared to opening and closing stretches, with win percentages climbing by an average of 4 to 7 points in weeks 5 through 9 according to aggregated conference records.
Analysts at major institutions note that early-season matchups often feature larger point spreads due to limited information on team adjustments, whereas mid-season contests reflect more balanced evaluations after multiple games have exposed strengths and weaknesses. Conference-specific trends emerge clearly when datasets break down home versus away underdog results, showing road underdogs in the SEC posting a 28 percent win rate historically while Big Ten underdogs at home reach 35 percent in similar scenarios.
Data Sources and Analytical Approaches
Comprehensive records from the NCAA Statistics Service provide the foundation for these examinations, supplemented by detailed box scores archived at individual conference offices and cross-referenced with weather, injury, and travel data from university reports. Statisticians apply regression models to isolate variables such as rest days between games, conference travel distances, and year-to-year roster turnover rates, which helps isolate seasonal effects from random variance. One study released by researchers at the University of Michigan in 2024 processed over 12,000 conference games and identified a consistent dip in underdog performance during November, attributed partly to increased physical demands and playoff implications affecting motivation levels.
Conference-by-Conference Breakdowns
Within the SEC, underdogs have demonstrated improved outcomes in September and October when facing ranked opponents, with historical data indicating a 31 percent win rate during those months versus 24 percent in later weeks. The ACC shows a different distribution, where underdogs secure victories more frequently in coastal divisions during early conference play, linked to milder weather patterns that reduce turnover rates in passing offenses. Big 12 records highlight a spike in underdog success during rivalry weeks, where motivation factors elevate performance metrics beyond baseline expectations derived from regular-season averages.
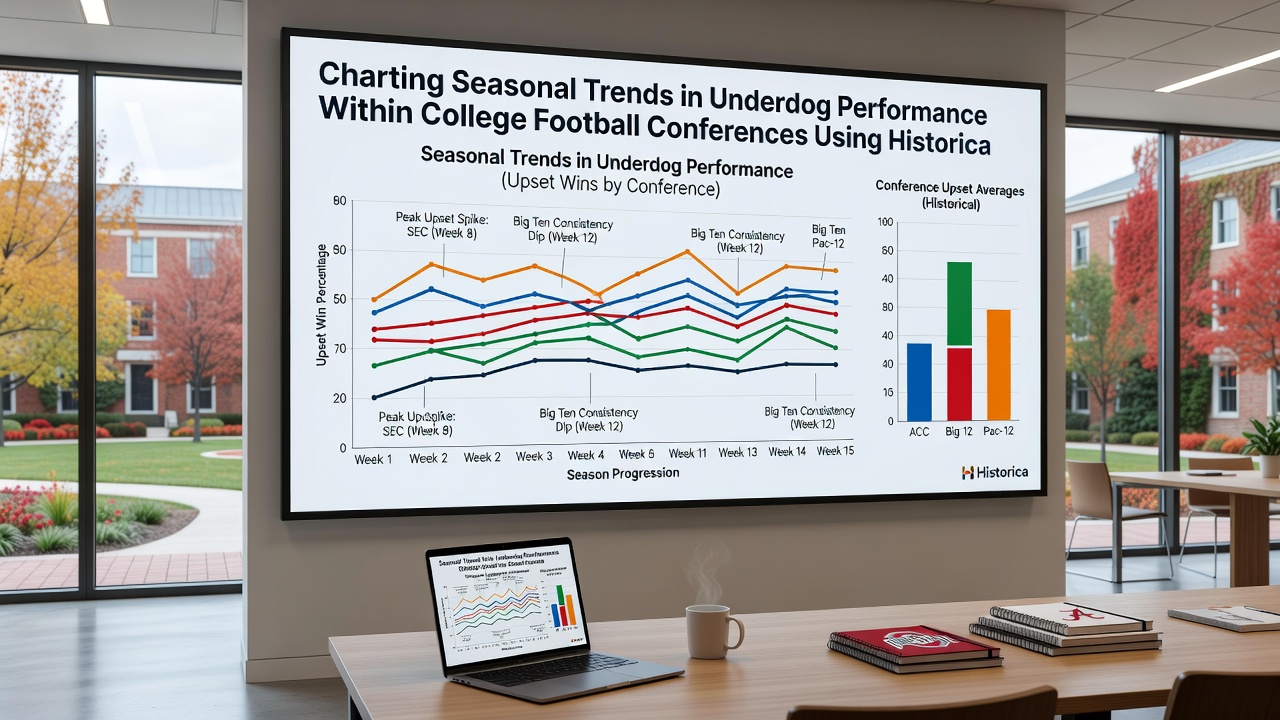
Observers tracking these metrics point to the role of quarterback stability as a key differentiator, with conferences maintaining higher rates of returning starters seeing steadier underdog results across the calendar. Data compiled through June 2026 continues to incorporate the most recent completed seasons, allowing analysts to test whether post-pandemic scheduling changes have altered prior trends in any measurable way.
Key Variables Influencing Trends
Travel distance emerges as a significant factor when datasets segment results by geographic spread, with western conference teams showing greater underdog resilience on short trips while eastern programs experience steeper declines after cross-country flights. Injury accumulation tracked through official medical reports correlates with late-season drops in underdog effectiveness, particularly in conferences that schedule back-to-back road games. Statistical models also account for coaching tenure, revealing that programs in their first three years under new leadership post lower underdog conversion rates early in seasons as schemes take time to integrate with personnel.
Long-term records from the NCAA Division I Football Statistics archive demonstrate that these patterns persist across multiple realignment cycles, suggesting structural elements within each conference exert stronger influence than temporary roster compositions. Additional context comes from academic analyses published by sports research centers at institutions such as Penn State, which apply machine learning techniques to predict deviations from historical baselines based on current season inputs.
Implications for Ongoing Analysis
Continued updates to these historical datasets enable more precise identification of anomalies, such as outlier seasons influenced by unusual weather events or conference expansion effects. Teams and analysts review these compiled figures to refine preparation strategies, focusing resources on periods where underdog probabilities diverge most sharply from season-long averages. The integration of advanced tracking data from recent years adds layers to older box-score statistics, allowing finer distinctions between performance trends driven by execution versus those shaped by external scheduling factors.
Conclusion
Archival examination of underdog results across college football conferences yields repeatable seasonal structures that researchers continue to refine with each completed season. These patterns, grounded in extensive records rather than isolated events, offer a factual basis for understanding how timing, location, and conference characteristics interact over time. As datasets expand through 2026 and beyond, the capacity to detect subtle shifts in these established trends grows accordingly, supporting more nuanced interpretations of conference play dynamics.