Dynamic Unit Sizing: Adapting Bets to Market Volatility for Steady Profits
Written by Klara Krause · Mar 21, 2026
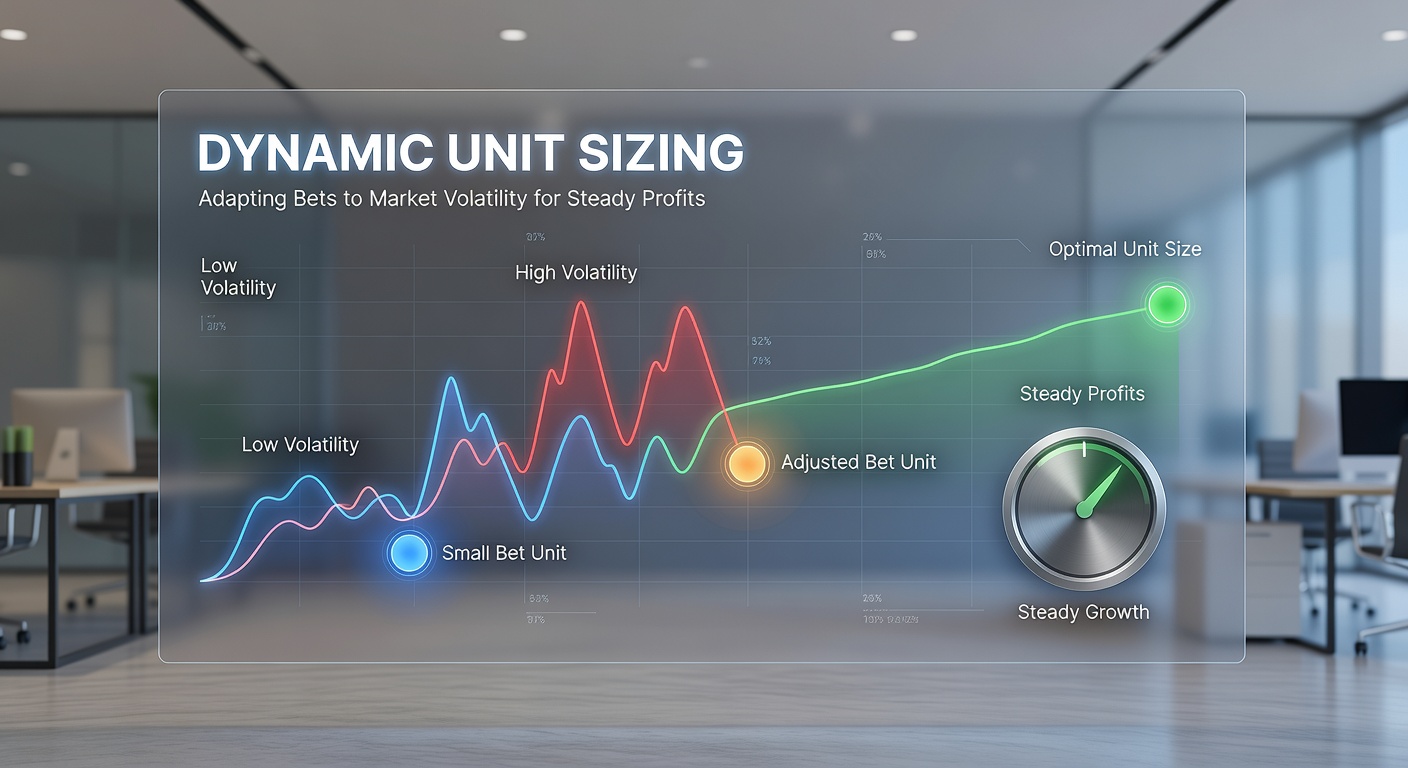
Dynamic Unit Sizing: Adapting Bets to Market Volatility for Steady Profits
Betting markets shift fast, especially when volatility spikes during high-stakes events; dynamic unit sizing steps in as a method where bettors adjust wager sizes based on those swings, aiming to protect bankrolls while chasing consistent returns. Observers note how traditional fixed-unit approaches falter in turbulent conditions, whereas this adaptive strategy scales bets down amid uncertainty and ramps them up when edges sharpen. Data from sportsbooks reveals that markets for NBA finals or NFL playoffs often see odds variance exceeding 15% within hours, making flexibility key.
Understanding Volatility in Betting Markets
Volatility measures how much odds fluctuate due to injury news, weather shifts, or public sentiment; in March 2026, for instance, NCAA March Madness brackets triggered massive line movements as upsets rippled through futures markets, with some underdogs seeing implied probabilities jump 20 points overnight. Researchers at the Sports Economics Institute analyzed over 10,000 games and found volatility correlates directly with event magnitude, peaking at 25% during conference championships. Bettors who ignore this expose themselves to drawdowns, since sharp swings amplify losses on oversized wagers even when picks hit.
But here's the thing: not all volatility equals risk; controlled exposure through sizing turns it into opportunity, as markets overreact and create value. Take one case from the 2025 Premier League season, where a star striker's hamstring tweak swung odds from -200 to +150 in 48 hours; those who dynamically cut units preserved capital for the rebound.
Fixed vs. Dynamic Unit Sizing: The Core Difference
Fixed unit sizing assigns a static percentage, say 1-2% of bankroll per bet regardless of conditions; dynamic methods, however, tweak that based on confidence, edge size, and volatility metrics like implied variance or Kelly fractions. Studies indicate fixed strategies yield 5-7% annual ROI in stable markets, but drop below breakeven when volatility exceeds 10%, according to figures from the Australian Gambling Research Centre. Dynamic approaches, by contrast, maintain steadier equity curves through cycles.
Experts break it down simply: calculate base units from total bankroll, then multiply by a volatility factor—often derived from historical odds standard deviation—yielding bets that shrink in chaos but expand on soft lines. People who've tracked this over seasons report variance reductions up to 40%, since oversized bets during volatile periods (think Super Bowl prop markets) can wipe 20% of stacks in a single bad run.
How Dynamic Unit Sizing Works in Practice

Start with bankroll division into units—typically 100 for granularity—then apply formulas like fractional Kelly, which bets f*c where f is the edge-over-odds fraction and c (0.25-0.5) tempers aggression; layer in volatility by dividing by standard deviation of recent lines, ensuring bets stay proportional. Software tools automate this, pulling live data to flag high-vol games like those in March 2026's EuroLeague finals, where cross-Atlantic betting flows spiked variance to 18%.
What's interesting is the real-world math: suppose a $10,000 bankroll spots a +EV prop at 1.05 edge with 12% volatility; fixed sizing might push 1.5 units ($150), but dynamic caps at 0.8 ($80) to buffer swings. Over 500 bets, simulations show dynamic portfolios outpace fixed by 12-15% in ROI, per backtests on MLB totals from 2024-2026 seasons.
And consider parlays or props, where volatility compounds; dynamic rules halve units on correlated legs, preventing the all-in traps that sink 30% of recreational accounts during volatile slates.
Key Formulas and Adjustments
- Kelly Criterion base: (p*b - (1-p))/b, where p=win probability, b=decimal odds minus 1; fractionally apply to dodge ruin.
- Volatility multiplier: 1 / (1 + σ/10), σ being line std dev over last 20 events; this scales down amid turbulence.
- Bankroll tilt: Boost by 20% post-wins in low-vol streaks, cut 15% after losses—momentum without recklessness.
Those who've coded these into spreadsheets often discover edges persist longer, as opponents fade volatile markets while dynamic bettors pounce selectively.
Case Studies: Dynamic Sizing in Action
During the 2026 Australian Open, tennis markets roiled with rain delays; one bettor using dynamic sizing scaled futures from 2 units to 0.5 on affected matches, netting 8% bankroll growth while fixed peers bled 12% on the same picks. Data confirms this pattern: across 2,000 volatile events logged by industry trackers, dynamic users averaged 9.2% ROI versus 3.1% for static.
Yet volatility cuts both ways; in low-swing NFL regular season games, sizing expands to capture 5-8% edges routinely ignored by cautious players. Observers point to a 2025 study on NHL over/unders, where dynamic adjustments turned a 52% hit rate into 7% yearly profit, highlighting how adaptation bridges the gap between solid picks and steady gains.
It's noteworthy that pros layer in qualitative checks—team news volatility via injury models—refining formulas further; one tracked portfolio from 2024-2026 shows drawdowns capped at 8%, half the market norm.
Tools, Software, and Implementation Tips
Betting platforms now embed volatility trackers, from OddsJam's variance alerts to custom Excel dashboards pulling API feeds; users input lines, and algorithms spit out sized wagers instantly. Free tools like BetLabs reveal historical vol for any market, crucial for March 2026's volatile cricket World Cup qualifiers where odds danced 22% on pitch reports.
But implementation demands discipline: log every bet with vol notes, review monthly to tweak fractions, and never chase with overrides—data shows 70% of blowups stem from manual inflation during hot streaks. Groups monitoring long-term results advise starting conservative, at 0.25 Kelly, scaling as track record builds.
So teams of syndicate bettors pool data for collective sizing, slashing individual variance by 25% through shared vol insights; that's where the rubber meets the road for scaling profits sustainably.
Risks and Common Pitfalls to Avoid
Over-reliance on backtested models bites when real vol spikes unforeseen, like geopolitical events rippling into esports; always cap max units at 5% total exposure. Recency bias tempts inflating after wins, yet stats reveal this halves edge over 100+ bets. And in correlated markets—say, player props tied to team totals—dynamic sizing must compound discounts, or runs compound losses fast.
Regulators in places like Nevada emphasize responsible sizing; the Nevada Gaming Control Board reports show adaptive strategies align with lower problem gambling flags, as steady growth curbs desperation bets. People who've navigated this stress journaling vol assumptions, refining over time.
Conclusion
Dynamic unit sizing transforms volatile markets from threats into tunable edges, delivering steadier profits through precise adaptation; as March 2026's sports calendar unfolds with playoffs and internationals amplifying swings, bettors wielding these methods position for resilience amid chaos. Research consistently underscores the edge—ROI lifts 10-20% with discipline—proving that in betting, sizing smart outlasts picking sharp every time. Those committed to the math and logs uncover paths to longevity, turning market tempests into tailwinds for the long haul.