Correlation Mapping Methods for Balancing Stakes on Disconnected Events
Written by Taylor Günther · May 24, 2026
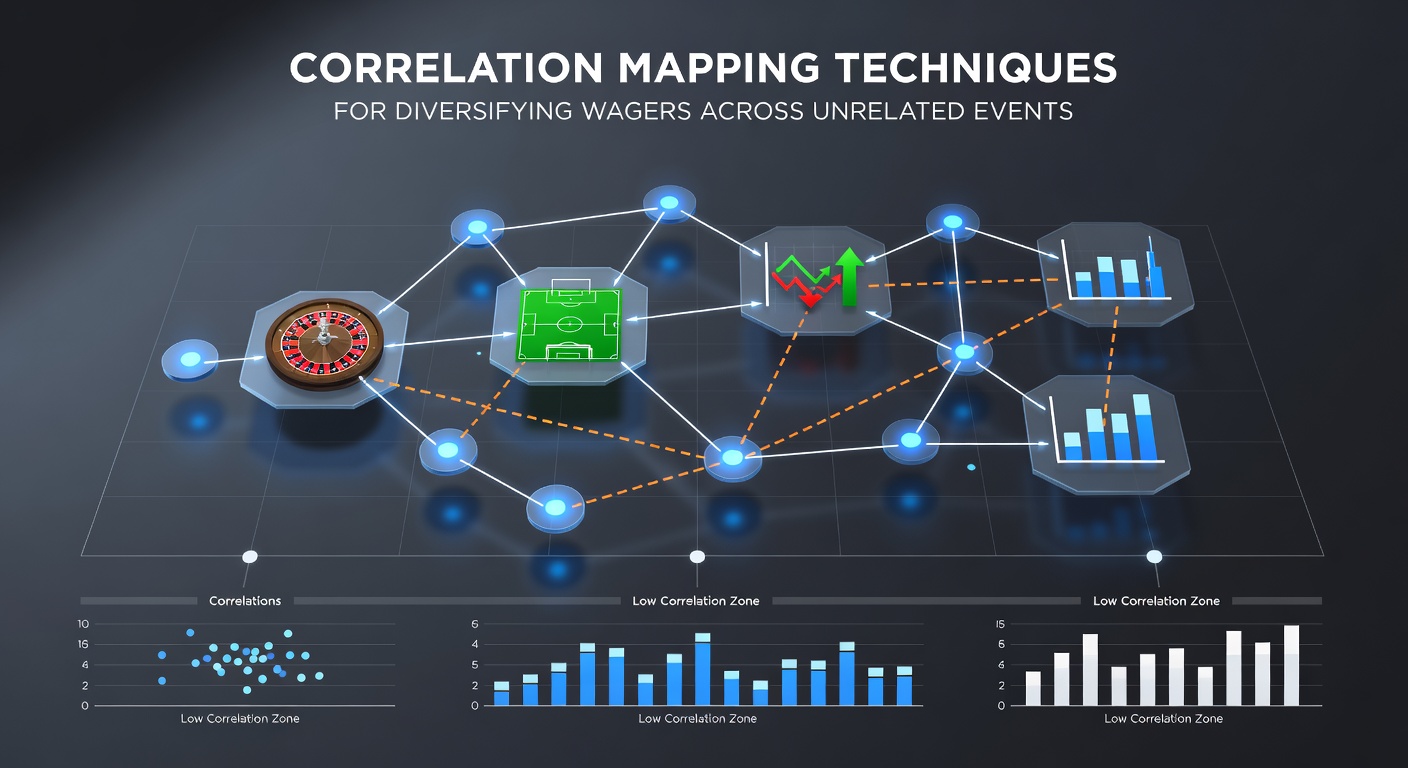
Correlation Mapping Methods for Balancing Stakes on Disconnected Events
Data from statistical analyses in sports wagering shows that mapping correlations between outcomes helps identify low-dependency events where stakes can spread without amplifying shared risk factors, and observers note this approach draws from portfolio diversification principles adapted to betting markets. Researchers in quantitative finance applied to gambling have documented how Pearson and Spearman coefficients calculate relationships between results in areas like soccer leagues and basketball conferences, allowing participants to select combinations where movements in one market rarely align with another. Studies indicate that events separated by geography, sport type, and timing often register correlation values below 0.2, which creates opportunities for reduced variance in overall returns when wagers combine across those lines. Analysts at institutions tracking global betting patterns have observed that platforms now integrate real-time correlation dashboards, pulling data from multiple books to flag pairs with negative or near-zero associations during live sessions.Core Statistical Foundations Behind the Mapping Process
Calculations begin with historical outcome datasets spanning several seasons, where software computes covariance matrices across variables such as total points scored, match winners, and margin thresholds, and these matrices then convert into visual heatmaps that highlight clusters of high or low interdependence. Experts apply filters for sample size and recency weighting, since older results can skew readings when team compositions or rules change mid-cycle.
Software packages like R and Python libraries enable rapid iteration over thousands of event pairs, producing ranked lists ordered by correlation strength, while industry reports from sources such as the American Gaming Association confirm increased adoption of these scripts among professional syndicates managing multi-million-dollar portfolios.
Practical Application Across Unrelated Sporting Disciplines
Take a scenario involving a European football match scheduled in the afternoon and an American baseball game occurring the same evening, where data collected over five years shows correlation coefficients hovering near 0.05 for win probabilities, allowing a stake on one outcome to offset potential drawdowns on teh other without shared weather or officiating influences. Mapping tools further segment by sub-markets, such as first-half totals versus full-game run lines, revealing additional layers of independence that traders exploit during overlapping international calendars.
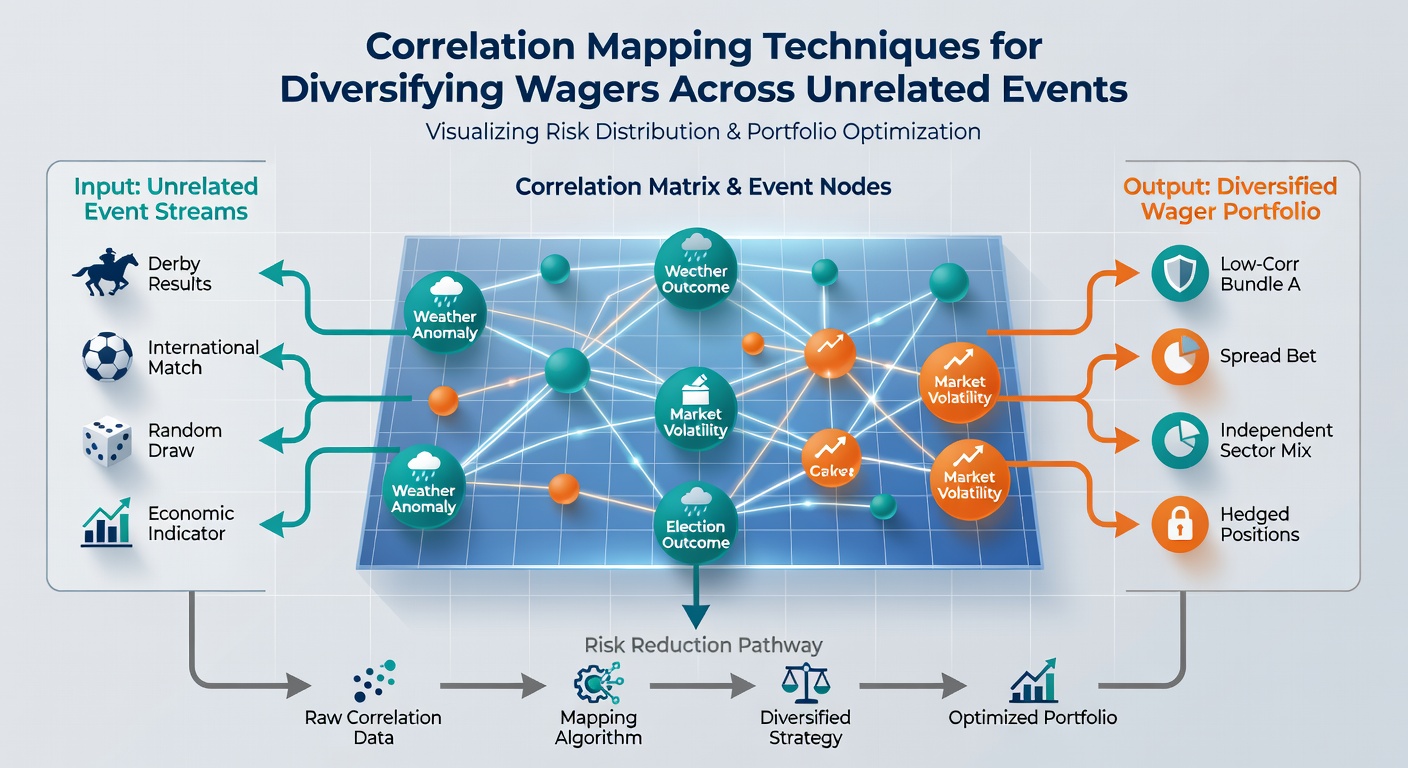
Additional examples surface in mixed-martial-arts bouts paired with tennis tournaments, where physiological and surface-specific factors rarely intersect, and figures from academic repositories including the Journal of Quantitative Analysis in Sports reveal average diversification gains measured through reduced portfolio standard deviation when such pairs enter rotation schedules. Operators in Australia and Canada have incorporated similar modules into their analytics suites, citing regulatory filings that track operator-side risk models built on these same correlation matrices.
Implementation Steps and Available Resources
Users start by exporting result histories from public APIs or proprietary databases, then normalize variables to account for different scoring systems before running pairwise tests, and the output feeds directly into stake allocation algorithms that adjust position sizes proportionally to measured independence. Several commercial platforms now bundle these functions with volatility overlays that update coefficients every 15 minutes during active periods.
Training modules offered through quantitative betting forums emphasize validation against out-of-sample periods, preventing overfitting that occurs when models latch onto temporary league anomalies rather than structural separations. Data compiled by research groups at European universities demonstrates that consistent application across 50-plus uncorrelated legs per cycle produces measurable compression in maximum drawdown statistics compared with concentrated approaches.
Limitations and Ongoing Refinements in the Field
Even low-correlation selections can experience temporary convergence during global events such as major tournaments or economic disruptions that affect multiple markets simultaneously, requiring periodic remapping to maintain accuracy. Edge cases arise with weather-dependent sports or referee-specific tendencies that introduce hidden linkages not captured in basic outcome data alone.
Refinements currently under development include machine-learning adjustments that incorporate sentiment indicators from social platforms and injury reports, expanding the input feature set beyond raw scores. Organizations monitoring responsible gambling practices, including those in New Zealand and Singapore, have referenced correlation-aware sizing tools in guidance documents aimed at helping participants structure more stable exposure patterns across unrelated fixtures.
Conclusion
Correlation mapping supplies a data-driven framework for constructing wager sets that minimize overlapping exposures, supported by established statistical methods and increasingly integrated into professional-grade platforms worldwide. Ongoing data collection from diverse regulatory regions continues to refine these techniques, ensuring practitioners receive updated matrices that reflect evolving competitive landscapes through 2026 and beyond.